Using synthetic workloads to test drive PernixData FVP might result into odd findings. The most meaningful approach to test FVP is to deploy the software to production in monitor mode, let Architect do its magic and enable acceleration after checking the recommendations after a couple of days. Despite it is possible to deploy FVP, test drive, and remove it, without any downtime to virtual machines, this approach might not fit to all environments.

If you have separate DEV/QA environments with sophisticated load generators, the solution is obviously. If you don't have that, there is another option by record production I/O traces and replay them in a FVP accelerated test platform.
Required Tools
- vscsiStats (If you have an ESXi hosts - You already have it)
- I/O Analyzer (Free Fling)
vscsiStats is a tool for storage profiling that is available since ESXi 4.1. It collects and reports counters on storage activity at the virtual SCSI device level.
VMware I/O Analyzer is a well-known virtual appliance than can not only generate synthetic IOs but also replay traces recorded by vscsiStats.
Testbed
I’ve tested PernixData FVP in my Homelab. No enterprise grade hardware, so don't expect outstanding results:
- Server: 5th gen Intel NUC (NUC5I5MYHE) running ESXi 6.0 Update 2 (Build: 3620759)
- Storage: HP Microserver N40L running FreeNAS providing iSCSI Datastores
- PernixData FVP Management Server 3.1.010920.4
- PernixData FVP Host Extension 3.1.0.4-39343
- Acceleration Resource: Samsung 850 EVO M.2 250GB SSD
Record Workloads with vscsiStats
Pick a Virtual Machine that is running the workload you want to record and locate the ESXi host where the VM is running.
- Connect to the ESXi host with SSH
- Get a list of all available worlds (Virtual Machines) with vscsiStats -l and note the worldGroupID
root@esx01:~ $ vscsiStats -l
Virtual Machine worldGroupID: 966699, Virtual Machine Display Name: io1, Virtual Machine Config File: /vmfs/volumes/datastore1/io1/io1.vmx, {
   Virtual SCSI Disk handleID: 8196 (scsi0:0)
   Virtual SCSI Disk handleID: 8197 (scsi0:1)
}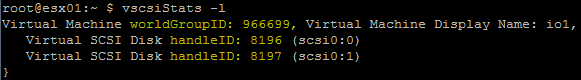
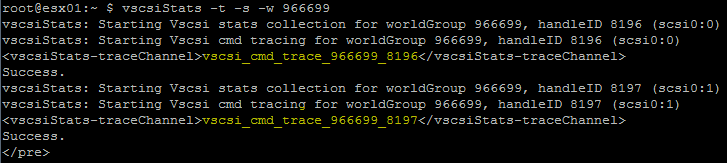
- Start SCSI command tracing with vscsiStats -t -s -w [worldGroupID]
root@esx01:~ $ vscsiStats -t -s -w 966699
vscsiStats: Starting Vscsi stats collection for worldGroup 966699, handleID 8196 (scsi0:0)
vscsiStats: Starting Vscsi cmd tracing for worldGroup 966699, handleID 8196 (scsi0:0)
vscsi_cmd_trace_966699_8196
Success.
vscsiStats: Starting Vscsi stats collection for worldGroup 966699, handleID 8197 (scsi0:1)
vscsiStats: Starting Vscsi cmd tracing for worldGroup 966699, handleID 8197 (scsi0:1)
vscsi_cmd_trace_966699_8197
Success.
- Write the the trace to a file with logchannellogger [traceChannel] [outputFile] &
root@esx01:~ $ logchannellogger vscsi_cmd_trace_966699_8197 io.trc &
- Wait at least 30 minutes to collect data.
- Stop command tracing with vscsiStats -x
root@esx01:~ $ vscsiStats -x
vscsiStats: Stopping all Vscsi stats collection for worldGroup 966699, handleID 8196 (scsi0:0)
Success.
vscsiStats: Stopping all Vscsi stats collection for worldGroup 966699, handleID 8197 (scsi0:1)
Success.
- Convert the binary trace file to a CSV file with vscsiStats -e [traceFile] > [csvFile]
root@esx01:~ $ vscsiStats -e io.trc > io.csv
Now you have a defined Workload that can be tested with, and without PernixData FVP. Replay the workload at least twice, with and without FVP to see the difference. You can run it a third time to see better Read Cache results.
Replay the Workloads with I/O Analyzer
- Download and deploy I/O Analyzer
- Connect to the VM console and login with root (Password vmware) to start I/O Analyzer
- Open the I/O Analyzer Webinterface
- Select Upload vscsi trace

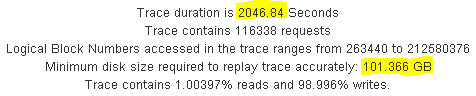
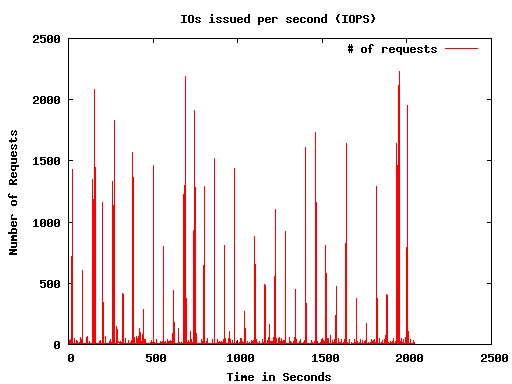
- View vscsi trace characteristics to determine trace replay configuration
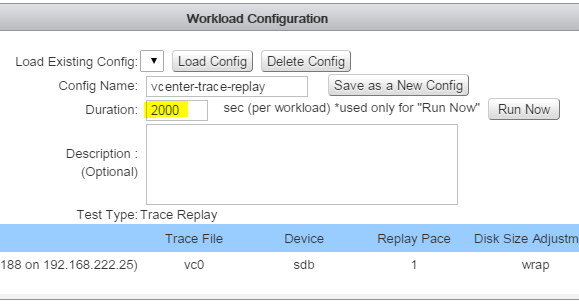
- The workload I'm using here was captured from my vCenter Server. Required parameters are
Duration: ~2000 Seconds
Disk Size: ~100GB
- Resize the 2nd Virtual Disk of the I/O Analyzer Appliance. This is a very important step because the default working set is far to low to get good results.
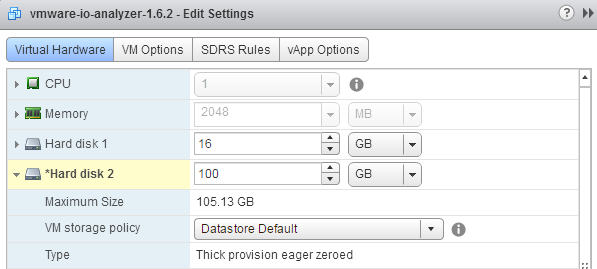
- Reboot the I/O Analyzer Appliance
- Start I/O Analyzer (Console Login root/vmware), navigate to the Workload configuration and add the ESXi Host running the Appliance to the configuration.

- Add a Workload Entry for the I/O Analyzer Appliance with the following configuration
Test Type: Trace Replay
Trace: [Your Trace]
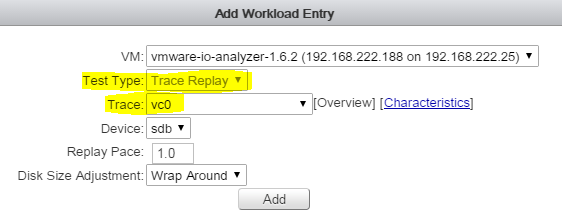
- Set the workload duration to the trace length
- Press Run Now
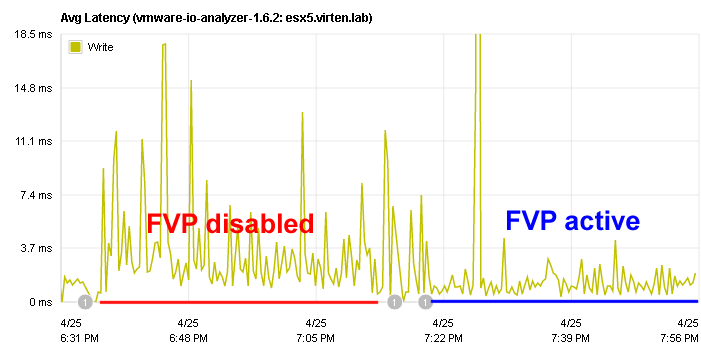
During the replay, you can monitor statistics with PernixData Architect or esxtop. When the test is finished, I/O Analyzer generates a report. After the first test, I've activated FVP and done the same test again:
Trace Replay Statistics in PernixData Architect
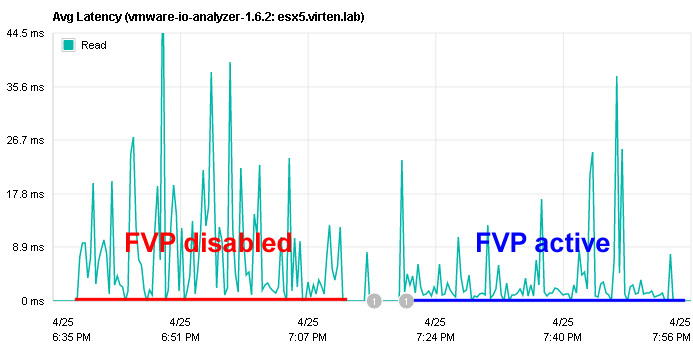
Acceleration was done with a cheap consumer grade SSD so the values are lower than you would expect it with an enterprise grade SSD and a better backend storage. Also the cache was cold, so the read latency spikes were caused by the storage.
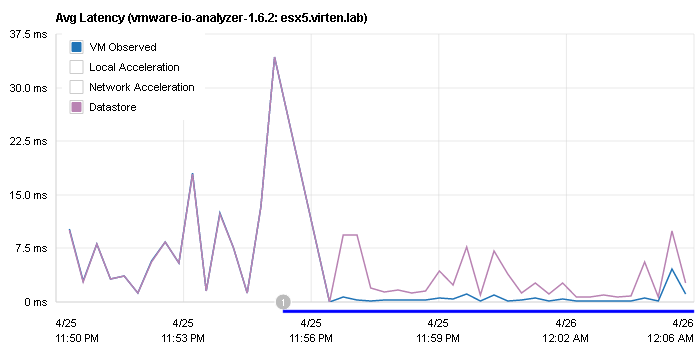
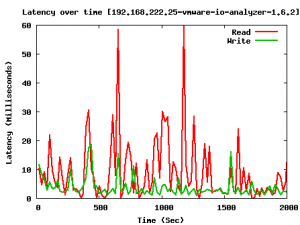
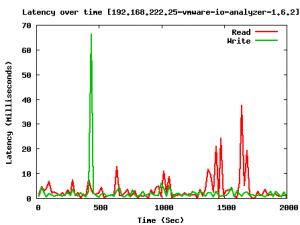
The report created by I/O Analyzer shows the following latency statistics (Left graph without FVP):
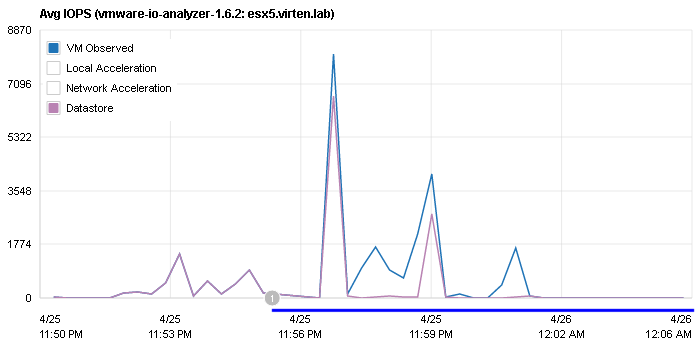
Another example shows the effect on a read intensive workload, a VDI boot storm. FVP has been activated in the blue marked zone. The average latency has dropped below 1ms while serving IOs from the local cache: