vSAN 6.6 RVC Guide
|
The "vSAN 6.6 RVC Guide" series explains how to manage your VMware Virtual SAN environment with the Ruby vSphere Console. RVC is an interactive command line tool to control and automate your platform. If you are new to RVC, make sure to read the Getting Started with Ruby vSphere Console Guide. All commands are from the latest vSAN 6.6 version.
In the fifth part, I'm working with commands related to the vSAN performance service. These commands are used to enable and configure the vSAN Performance Service and gather performance related information.
- vsan.perf.cluster_info
- vsan.perf.resync_dashboard
- vsan.perf.stats_object_create
- vsan.perf.stats_object_info
- vsan.perf.stats_object_delete
- vsan.perf.stats_object_setpolicy
vsan.perf.cluster_info ~cluster
The vSAN performance service monitors the performance of Virtual SAN clusters, hosts, disks, and VMs. Before you enable the Virtual SAN performance service, make sure that the cluster is properly configured and has no unresolved health problems. The vsan.perf.cluster_info command allows you to identify wheter there are any unresolved issues.
Example 1 – Display host information:
> vsan.perf.cluster_info ~cluster
+------------------+--------------+--------+
| Hostname         | Role         | Issues |
+------------------+--------------+--------+
| vesx2.virten.lab | Agent        | None   |
| vesx1.virten.lab | Agent        | None   |
| vesx3.virten.lab | CMMDS Master | None   |
+------------------+--------------+--------+
vsan.perf.resync_dashboard [-r] ~cluster|~host
This command shows what happens when a mirror resync is in progress. If a host fails or is going into maintenance mode, you should watch the resync status here. The command can be run once or with an refresh interval.
- -r, --refresh-rate: Refresh interval (in sec). Default is no refresh
Example 1 - Resync Dashboard where nothing happens:
> vsan.perf.resync_dashboard ~cluster
Querying all objects in the system from vesx1.virten.lab ...
Got all the info, computing table ...
+-----------+-----------------+---------------+
| VM/Object | Syncing objects | Bytes to sync |
+-----------+-----------------+---------------+
+-----------+-----------------+---------------+
| Total     | 0               | 0.00 GB       |
+-----------+-----------------+---------------+
Example 2 - Resync Dashboard after a host has been put into maintenance mode. Refreshed every 10 seconds:
> vsan.perf.resync_dashboard --refresh-rate 10 ~cluster
Querying all VMs on VSAN ...
Querying all objects in the system from esx1.virten.local ...
Got all the info, computing table ...
+-----------+-----------------+---------------+
| VM/Object | Syncing objects | Bytes to sync |
+-----------+-----------------+---------------+
+-----------+-----------------+---------------+
| Total     | 0               | 0.00 GB       |
+-----------+-----------------+---------------+
Querying all objects in the system from esx1.virten.local ...
Got all the info, computing table ...
+-----------------------------------------------------------------+-----------------+---------------+
| VM/Object                                                       | Syncing objects | Bytes to sync |
+-----------------------------------------------------------------+-----------------+---------------+
| vm1                                                             | 1               |               |
|    [vsanDatastore] 5078bd52-2977-8cf9-107c-00505687439c/vm1.vmx |                 | 0.17 GB       |
+-----------------------------------------------------------------+-----------------+---------------+
| Total                                                           | 1               | 0.17 GB       |
+-----------------------------------------------------------------+-----------------+---------------+
Querying all objects in the system from esx1.virten.local ...
Got all the info, computing table ...
+--------------------------------------------------------------------+-----------------+---------------+
| VM/Object                                                          | Syncing objects | Bytes to sync |
+--------------------------------------------------------------------+-----------------+---------------+
| vm1                                                                | 1               |               |
|    [vsanDatastore] 5078bd52-2977-8cf9-107c-00505687439c/vm1.vmx    |                 | 0.34 GB       |
| debian                                                             | 1               |               |
|    [vsanDatastore] 6978bd52-4d92-05ed-dad2-005056871792/debian.vmx |                 | 0.35 GB       |
+--------------------------------------------------------------------+-----------------+---------------+
| Total                                                              | 2               | 0.69 GB       |
+--------------------------------------------------------------------+-----------------+---------------+
[...]
vsan.perf.stats_object_create [-p|-o] ~cluster
All statistics collected by the vSAN performance service are stored in the Stats DB object. This command creates the Database object and enables the vSAN performance service.
- -p, --policy-str: Policy, expressed as string, e.g. vSAN format
- -o, --policy: Policy, reference to SPBM profile
A policy defines how objects are stored in the Virtual SAN. Available values are:
- hostFailuresToTolerate (Number of failures to tolerate)
- forceProvisioning (If VSAN can't fulfill the policy requirements for an object, it will still deploy it)
- stripeWidth (Number of disk stripes per object)
- cacheReservation (Flash read cache reservation)
- proportionalCapacity (Object space reservation)
Example 1 – Create the vSAN Stats DB with the default policy:
> vsan.perf.stats_object_create ~cluster
Creating vSAN Stats DB object, which will enable vSAN Performance Service ...
Task: Enable vSAN performance service
New progress: 1%
Task result: success
Example 2 - Create the vSAN Stats DB with a custom policy:
> vsan.perf.stats_object_create -p '(("hostFailuresToTolerate" i1) ("stripeWidth" i1))' ~cluster
VirtualMachineDefinedProfileSpec(
  profileData: {:extensionKey=>"com.vmware.vim.sps",
   :objectData=>"((\"hostFailuresToTolerate\" i1) (\"stripeWidth\" i1))"},
  profileId: ""
)
Creating vSAN Stats DB object, which will enable vSAN Performance Service ...
Task: Enable vSAN performance service
New progress: 1%
Task result: success
vsan.perf.stats_object_info ~cluster
All statistics collected by the vSAN performance service are stored in the Stats DB object. This command displays vSAN Stats DB object information including:
- Object UUID
- SPBM Profile
- vSAN Policy
- vSAN Object Health
- DOM Object Info (Size / Distribution)
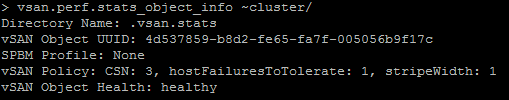
Example 1 – Display vSAN Stats DB object information:
>  vsan.perf.stats_object_info ~cluster/
Directory Name: .vsan.stats
vSAN Object UUID: 4d537859-b8d2-fe65-fa7f-005056b9f17c
SPBM Profile: None
vSAN Policy: CSN: 3, hostFailuresToTolerate: 1, stripeWidth: 1
vSAN Object Health: healthy

DOM Object: 4d537859-b8d2-fe65-fa7f-005056b9f17c (v5, owner: vesx3.virten.lab, proxy owner: None, policy: CSN = 3, stripeWidth = 1, hostFailuresToTolerate = 1)
  RAID_1
    Component: 4d537859-00d1-8766-75d4-005056b9f17c (state: ACTIVE (5), host: vesx3.virten.lab, md: mpx.vmhba0:C0:T3:L0, ssd: mpx.vmhba0:C0:T1:L0,
                                                     votes: 1, usage: 0.3 GB, proxy component: false)
    Component: 4d537859-5c18-8a66-b254-005056b9f17c (state: ACTIVE (5), host: vesx1.virten.lab, md: mpx.vmhba0:C0:T2:L0, ssd: mpx.vmhba0:C0:T1:L0,
                                                     votes: 1, usage: 0.3 GB, proxy component: false)
  Witness: 4d537859-aaf2-8b66-898d-005056b9f17c (state: ACTIVE (5), host: vesx2.virten.lab, md: mpx.vmhba0:C0:T3:L0, ssd: mpx.vmhba0:C0:T1:L0,
                                                 votes: 1, usage: 0.0 GB, proxy component: false)
  Extended attributes:
    Address space: 273804165120B (255.00 GB)
    Object class: vmnamespace
    Object path: /vmfs/volumes/vsan:520e0160c109abd2-45aff5378f18f74a/
    Object capabilities: NONE
vsan.perf.stats_object_delete ~cluster
All statistics collected by the vSAN performance service are stored in the Stats DB object. This command deletes the Database object and disables the vSAN performance service.
Example 1 – Delete vSAN Stats DB:
> vsan.perf.stats_object_delete ~cluster/
Deleting vSAN Stats DB object, which will stop vSAN Performance Service ...
Task: Disable vSAN performance service
New progress: 1%
New progress: 50%
Task result: success
vsan.perf.stats_object_setpolicy [-p|-o] ~cluster
All statistics collected by the vSAN performance service are stored in the Stats DB object. This command changes the policy of the Database object.
- -p, --policy-str: Policy, expressed as string, e.g. vSAN format
- -o, --policy: Policy, reference to SPBM profile
A policy defines how objects are stored in the Virtual SAN. Available values are:
- hostFailuresToTolerate (Number of failures to tolerate)
- forceProvisioning (If VSAN can't fulfill the policy requirements for an object, it will still deploy it)
- stripeWidth (Number of disk stripes per object)
- cacheReservation (Flash read cache reservation)
- proportionalCapacity (Object space reservation)
Example 1 – Change the vSAN Stats DB policy:
> vsan.perf.stats_object_setpolicy -p '(("hostFailuresToTolerate" i1) ("stripeWidth" i0))' ~cluster
VirtualMachineDefinedProfileSpec(
  profileData: {:extensionKey=>"com.vmware.vim.sps",
   :objectData=>"((\"hostFailuresToTolerate\" i1) (\"stripeWidth\" i0))"},
  profileId: ""
)
true