Part 5, the last part, of the "Manage VSAN with RVC" series covers only one command: VSAN Observer. Observer is a powerful command that gathers performance related metrics down to the physical disks. Statistics can be exported in JSON, saved as HTML or directly viewed from a web browser.
- vsan.observer
VSAN Observer
Basics
All commands can be configured with an Interval in which Observer will collect stats and a maximum runtime. Default is to collect stats each 60 seconds and run 2 hours. Keep in mind that VSAN Observer runs from memory when adjusting runtime settings. Options to change the default settings for runtime and interval are:
   --interval, -i :   Interval (in sec) in which to collect stats
--max-runtime, -m :   Maximum number of hours to collect stats. Caps memory usage.
Dump Data in JSON
VSAN Observer queries stats from each ESXi host in the JSON format. That output can be written to a file to be used by other tools. In each collection interval, stats are gathered from all hosts and written to a new line.
Example: I am going to run a single collection, and stop them with CTRL+C after the first time:
/localhost/DC> vsan.observer ~cluster --filename /tmp/observer.json
Press + to stop observing at any point ...
2014-01-09 20:15:56 +0000: Collect one inventory snapshot
Query VM properties: 0.16 sec
Query Stats on esx3.virten.lab: 0.65 sec (on ESX: 0.16, json size: 33KB)
Query Stats on esx2.virten.lab: 2.05 sec (on ESX: 0.51, json size: 461KB)
Query Stats on esx4.virten.lab: 2.19 sec (on ESX: 1.25, json size: 409KB)
Query Stats on esx1.virten.lab: 2.13 sec (on ESX: 0.50, json size: 472KB)
Query CMMDS from esx1.virten.lab: 1.84 sec (json size: 349KB)
2014-01-09 20:16:18 +0000: Collection took 21.98s, sleeping for 38.02s
2014-01-09 20:16:18 +0000: Press + to stop observing
^C2014-01-09 20:16:44 +0000: Execution interrupted, wrapping up ...
To format json output, i use python -mjson.tools:
vc:~ # cat /tmp/observer.json | python -mjson.tool |less
The output looks like this, but be warned, there are lots of data. One collection of my small 4 Node Cluster generates 110,000 lines:
[...]
       "vsi": {
            "esx1.virten.lab": {
                "cbrc": {
                    "dcacheStats": null
                },
                "cbrc-taken": 1389298607.2460959,
                "disks-taken": 1389298607.2457359,
                "disks.stats": {
                    "SanDisk_SDSSDP064G": {
                        "atsOps": 0,
                        "blocksCloneRead": 0,
                        "blocksCloneWrite": 0,
                        "blocksDeleted": 0,
                        "blocksRead": 36723527,
                        "blocksWritten": 50546140,
                        "blocksZeroed": 0,
                        "cloneReadOps": 0,
                        "cloneWriteOps": 0,
                        "commands": 3558146,
                        "dAvgLatency": 3748,
                        "dAvgMoving": 1288,
                        "deleteOps": 0,
                        "failedAtsOps": 0,
[...]
Generate HTML bundle
To visualize the huge amount of data, VSAN Observer can generate a HTML bundle after completion:
/localhost/DC> vsan.observer ~cluster --generate-html-bundle /tmp/
Press + to stop observing at any point ...

2014-01-09 20:37:44 +0000: Collect one inventory snapshot
Query VM properties: 0.17 sec
Query Stats on esx3.virten.lab: 0.50 sec (on ESX: 0.16, json size: 33KB)
Query Stats on esx2.virten.lab: 2.02 sec (on ESX: 0.51, json size: 461KB)
Query Stats on esx1.virten.lab: 2.15 sec (on ESX: 0.54, json size: 472KB)
Query Stats on esx4.virten.lab: 2.99 sec (on ESX: 2.28, json size: 409KB)
Query CMMDS from esx1.virten.lab: 1.84 sec (json size: 349KB)
2014-01-09 20:38:06 +0000: Live-Processing inventory snapshot
2014-01-09 20:38:06 +0000: Collection took 21.93s, sleeping for 38.07s
2014-01-09 20:38:06 +0000: Press + to stop observing
^C2014-01-09 20:38:12 +0000: Execution interrupted, wrapping up ...
2014-01-09 20:38:12 +0000: Writing out an HTML bundle to /tmp/vsan-observer-2014-01-09.20-38-12.tar.gz ...
2014-01-09 20:38:12 +0000: Writing statsdump for system mem ...
2014-01-09 20:38:12 +0000: Writing statsdump for pnics ...
2014-01-09 20:38:12 +0000: Writing statsdump for slabs ...
2014-01-09 20:38:12 +0000: Writing statsdump for heaps ...
2014-01-09 20:38:12 +0000: Writing statsdump for pcpus ...
2014-01-09 20:38:12 +0000: Writing statsdump for ssds ...
2014-01-09 20:38:12 +0000: Writing statsdump for worldlets ...
2014-01-09 20:38:12 +0000: Writing statsdump for helper worlds ...
2014-01-09 20:38:12 +0000: Writing statsdump for DOM ...
2014-01-09 20:38:12 +0000: Writing statsdump for LSOM components ...
2014-01-09 20:38:12 +0000: Writing statsdump for LSOM hosts ...
2014-01-09 20:38:12 +0000: Writing statsdump for PLOG disks ...
2014-01-09 20:38:12 +0000: Writing statsdump for LSOM disks ...
2014-01-09 20:38:12 +0000: Writing statsdump for CBRC ...
2014-01-09 20:38:12 +0000: Writing statsdump for VMs ...
2014-01-09 20:38:12 +0000: Writing statsdump for VSCSI ...
2014-01-09 20:38:12 +0000: Writing statsdump for Physical disks ...
VSAN Observer Live View
VSAN Observer also has an implemented web server that allows to view the same output as html-bundle live. Just start it and open http://<vcenter>:8010 in your browser:
/localhost/DC> vsan.observer ~cluster --run-webserver --force
[2014-01-09 20:44:08] INFO  WEBrick 1.3.1
[2014-01-09 20:44:08] INFO  ruby 1.9.2 (2011-07-09) [x86_64-linux]
[2014-01-09 20:44:08] WARN  TCPServer Error: Address already in use - bind(2)
Press + to stop observing at any point ...

2014-01-09 20:44:08 +0000: Collect one inventory snapshot
[2014-01-09 20:44:08] INFO  WEBrick::HTTPServer#start: pid=26029 port=8010
The Webinterface comes up with 8 Views. I am going to cover the most useful stats for now:![]()
- SAN Client
- VSAN Disks
- VSAN Disks (deep-dive)
- PCPU
- Memory
- Distribution
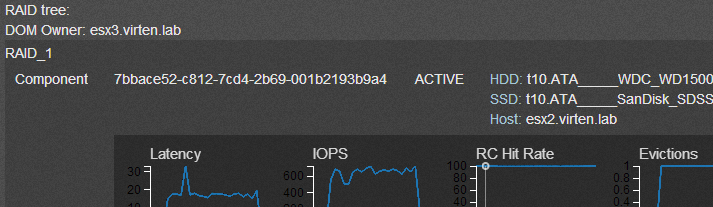
- DOM Owner
- VMs
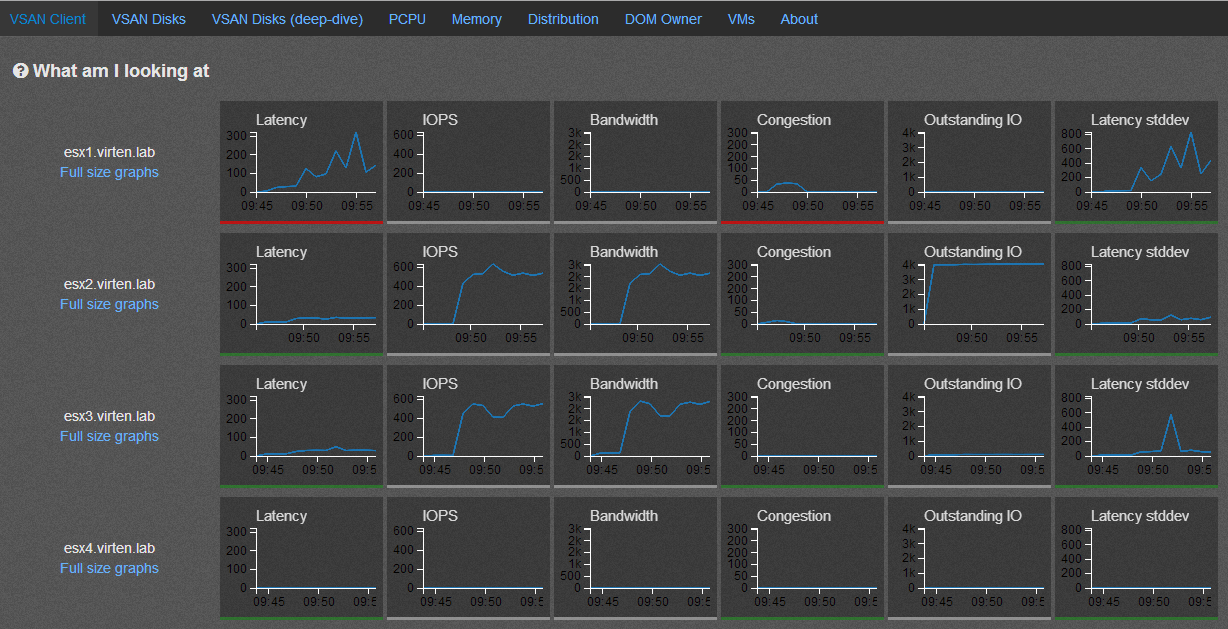
SAN Client
This view shows VSAN statistics from the view point of the host. The view represents the performance as seen by VMs running on the hosts for which statistics are shown. You should see balanced statistics in that view. To balance the workload you can try to use vMotion to move VMs to other ESXi hosts in the Cluster. This might help, but does not always solve the problem because the performance issue can be caused by any disk on any host in the VSAN cluster.
VSAN Disks
This view shows aggregated statistics from all disks in an host. This might help to identify the ESXi host which causes contention.
VSAN Disks (deep-dive)
This view shows detailed information about physical disks on each host. This allows to further identify when single disks are causing contention. You can view latency and IOPS from all disks (SSD and MD) and special metrics like RC Hit rate and WriteBuffer load.
VM
This view allows to analyse single VMs. You can drill down each virtual disk and see where it is physically located. You can see objects and components performance metrics.