This post explains how you can troubleshoot network problems by capturing network traces of ESXi host by using the tcpdump-uw and pktcap-uw utility. The pktcap-uw tool is an enhanced packet capture and analysis tool that can be used in place of the legacy tcpdump-uw tool. The pktcap-uw tool is included by default in ESXi 5.5 and later. This post explains the main differences of both tools and how to use them.
tcpdump-uw vs. pktcap-uw - It's not the same!
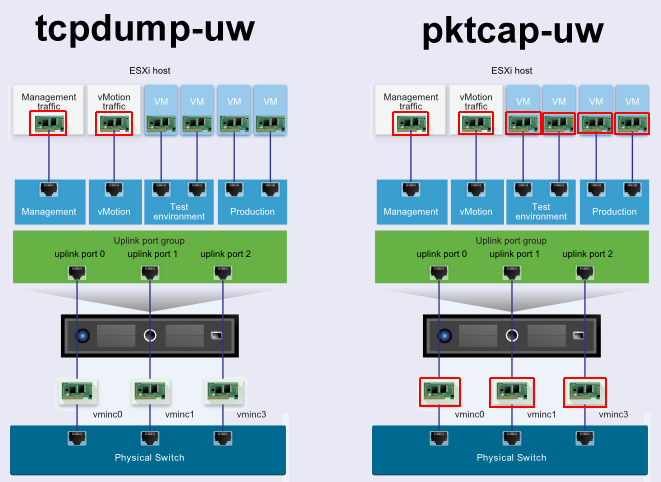
The tcpdump-uw utility captures traffic from VMkernel adapters. The pktcap-uw utility, introduced in ESXi 5.5 can capture traffic that flows through physical network adapters, VMkernel adapters, and virtual machines adapters.
But it's more complex...
Capture Points
There is no concept of traffic flow in tcpdump-nw. When you monitor vmk0 with tcpdump-nw there is only one capture point, the VMkernel interface directely and you can see both, incoming and outgoing packets. The pktcap-uw utility introduces the concept of capture points. With capture points you can define at which position you want to capture the traffic. For capturing VMkernel traffic you have 2 capture points:
- PortOutput: Packets from a port on the virtual switch to the VMkernel adapter.
- PortInput: Packets from the VMkernel adapter to a port on the virtual switch. (default)
To demonstrate that we will use a simple ICMP packet (ping).
In tcpdump-nw you see both packets, the ICMP echo request, and the reply:
~ # tcpdump-uw -i vmk0 icmp
tcpdump-uw: verbose output suppressed, use -v or -vv for full protocol decode
listening on vmk0, link-type EN10MB (Ethernet), capture size 96 bytes
18:51:00.953859 IP 192.168.222.50 > esx6.virten.lab: ICMP echo request, id 1, seq 130, length 40
18:51:00.955070 IP esx6.virten.lab > 192.168.222.50: ICMP echo reply, id 1, seq 130, length 40
In pktcap-nw, without specifying the capture point, you see one packet fom the default capture point PortInput (That's the ICMP echo reply):
~ # pktcap-uw --vmk vmk0 --proto 0x01
The name of the vmk is vmk0
The session filter IP protocol is 0x01
No server port specifed, select 46535 as the port
Output the packet info to console.
Local CID 2
Listen on port 46535
Accept...Vsock connection from port 1036 cid 2
18:52:36.569651[1] Captured at PortInput point, TSO not enabled, Checksum not offloaded and not verified, length 74.
 Segment[0] ---- 74 bytes:
 0x0000: bc5f f445 3122 b8ae ed75 0868 0800 4500
 0x0010: 003c 9e58 0000 4001 9ecb c0a8 de19 c0a8
 0x0020: de32 0000 54d8 0001 0083 6162 6364 6566
 0x0030: 6768 696a 6b6c 6d6e 6f70 7172 7374 7576
 0x0040: 7761 6263 6465 6667 6869
To capture the ICMP echo request (the incoming packet from the VMkernel perspective, or the outgoing packet from the virtual switch perspective) you have define the capture point:
~ # pktcap-uw --vmk vmk0 --proto 0x01 --capture PortOutput
The name of the vmk is vmk0
The session filter IP protocol is 0x01
The session capture point is PortOutput
No server port specifed, select 46574 as the port
Output the packet info to console.
Local CID 2
Listen on port 46574
Accept...Vsock connection from port 1038 cid 2
18:53:07.984803[1] Captured at PortOutput point, TSO not enabled, Checksum not offloaded and not verified, length 74.
 Segment[0] ---- 74 bytes:
 0x0000: b8ae ed75 0868 bc5f f445 3122 0800 4500
 0x0010: 003c 0c59 0000 8001 f0ca c0a8 de32 c0a8
 0x0020: de19 0800 4cd4 0001 0087 6162 6364 6566
 0x0030: 6768 696a 6b6c 6d6e 6f70 7172 7374 7576
 0x0040: 7761 6263 6465 6667 6869
The full list of capture points is available here.
Packet Interpretation
Compared to tcpdump-nw, pktcap-uw does not interpret packets. To demonstrate that we will use a simple ICMP packet (ping).
In tcpdump-nw the standard output is a human readable:
~ # tcpdump-uw -i vmk0 icmp
tcpdump-uw: verbose output suppressed, use -v or -vv for full protocol decode
listening on vmk0, link-type EN10MB (Ethernet), capture size 96 bytes
18:07:40.246941 IP esx6.virten.lab > 192.168.222.50: ICMP echo reply, id 1, seq 125, length 40
In pktcap-nw we see the raw packet in hex:
~ # pktcap-uw --vmk vmk0 --proto 0x01
The name of the vmk is vmk0
The session filter IP protocol is 0x01
No server port specifed, select 44749 as the port
Output the packet info to console.
Local CID 2
Listen on port 44749
Accept...Vsock connection from port 1033 cid 2
18:05:57.332697[1] Captured at PortInput point, TSO not enabled, Checksum not offloaded and not verified, length 74.
 Segment[0] ---- 74 bytes:
 0x0000: bc5f f445 3122 b8ae ed75 0868 0800 4500
 0x0010: 003c 731f 0000 4001 ca04 c0a8 de19 c0a8
 0x0020: de32 0000 54e2 0001 0079 6162 6364 6566
 0x0030: 6768 696a 6b6c 6d6e 6f70 7172 7374 7576
 0x0040: 7761 6263 6465 6667 6869
Of course, if you write packets to a file, both tools will have the same result:
~ # tcpdump-uw -i vmk0 icmp -w tcpdump.pcap
~ # pktcap-uw --vmk vmk0 --proto 0x01 -o
If you want tcpdump-nw to display the raw packet, you can use the -X or -XX option.
~ # tcpdump-uw -i vmk0 icmp -XX
tcpdump-uw: verbose output suppressed, use -v or -vv for full protocol decode
listening on vmk0, link-type EN10MB (Ethernet), capture size 96 bytes
18:08:09.661592 IP esx6.virten.lab > 192.168.222.50: ICMP echo reply, id 1, seq 129, length 40
        0x0000:  bc5f f445 3122 b8ae ed75 0868 0800 4500  ._.E1"...u.h..E.
        0x0010:  003c 74bc 0000 4001 c867 c0a8 de19 c0a8  .<t...@..g......
        0x0020:  de32 0000 54da 0001 0081 6162 6364 6566  .2..T.....abcdef
        0x0030:  6768 696a 6b6c 6d6e 6f70 7172 7374 7576  ghijklmnopqrstuv
        0x0040:  7761 6263 6465 6667 6869                 wabcdefghi
Protocol Knowledge
In the examples above I used ICMP packets to demonstrate the differences. With tcpdump-uw I used the protocol name "icmp" as expression filter. In pktcap-uw I used the protocol ID from icmp. Why? Because pktcap-uw does not care about IP protocols. The protocol ID is part of the IPv4 header and the protocal ID from ICMP is 1. You can find the protocol in the output in hex format here:
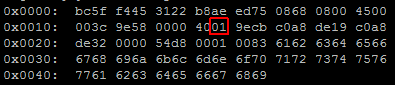
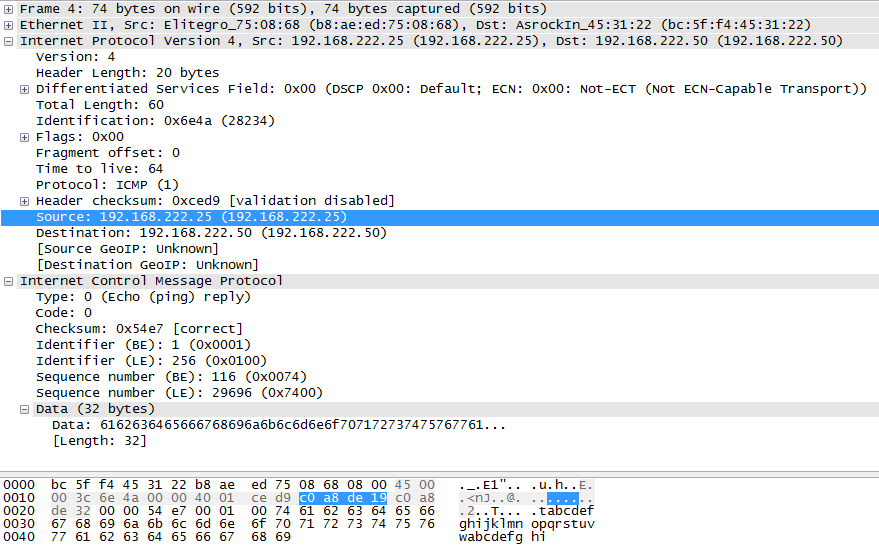
At this point you might want to have a List of IP protocol numbers. If you are not familiar with network protocols I highly encourage you to capture a few packets and load them into Wireshark. It will explain the meaning of all the hex values that you can see in captured packets:
tcpdump-uw Usage
The tcpdump-uw tool allows to capture packets from VMkernel interfaces. All parameters are optional and can be used in any order. If you run tcpdump-uw without any options, it dumps all packets to the screen. I've tried to group parameters and sort them by its importance in ESXi environments.
- -i vmk[n] - Specifies the vmkernel interface to listen. If unspecified, the interface with the lowest number is used, for example vmk0.
- expression - Used to filter packets. If no expression is given, all packets will be dumped. For example "tcpdump-uw icmp" will only dump ICMP packets and "tcpdump-uw not port 22" will ignore packets on port 22 (SSH).
- -s snapshot-length - Truncates packets after [snapshot-length] bytes. It is a good practise to limit packets to the smallest size possible while still retaining the protocol information you're interested in.
- -B buffer_size - System buffer size in units of KiB (1024 bytes). Due to buffer constraints tcpdump-uw can only capture a maximum of 8138 bytes . The -B 9 option increases the buffer to allow the capture of up to 9014 bytes. This option works in conjunction with the -s option and is only required when jumbo frames are enabled.
- -c count - Exit tcpdump after receiving the [count] packets.
- -w file - Write raw packets to [file] for later analyses with Wireshark or the -r option.
- -v - Verbose output. For example, the time to live, identification, total length and options in an IP packet are printed. Even more verbose output with -vv and -vvv.
- -C file_size - Limits the filesize when using the -w option in units of bytes. When the outfile configured with -w has become larger than [file_size] a new one with a nummeric appendix is created.
- -G rotate_seconds - Rotates the dump file specified with the -w option every [rotate_seconds] seconds. Works in conjunction with the -w option which must include a valid time format.
- -W filecount - Limits the number of files created when used in conjunction with the -C option. When [filecount] is reached, the oldest files are overwritten.
- -z postrotate-command - Used in conjunction with the -C or -G option. This will run run a [postrotate-command] when the captured file has been closed after each rotation. For example, specifying -z gzip will compress the capure file using gzip.
- -r file - Read and replays packets from [file] which was created with the -w option.
- -F filter_file - Use [filter_file] as input for the filter expression. Any additional expression given on the command line is ignored.
- -X - Print the data of each packet (minus its link level header) in hex and ASCII.
- -XX - Print the data of each packet including its link level header in hex and ASCII.
- -Z user - Changes the user ID for the savefile to [user]
- -E algo:secret - Use [algo:secret] for decrypting IPsec ESP packets.
- -M secret - Use [secret] for validating TCP segments digests when using TCP-MD5.
- -T type - Forces packets, which are selected by the expression, to be interpreted as the specified type, for example snmp (Simple Network Management Protocol).
- -y datalinktype - Set the data link type to use while capturing packets, for example Ethernet.
tcpdump-uw Examples
List VMkernel interfaces to be used with tcpdump-nw:
~ # esxcli network ip interface list
Collect packet traces from a specific VMkernel interface, for example vmk0:
~ # tcpdump-uw -i vmk0
When you run the command above in a SSH session you create a loop. Each captured packet is transfered to your workstation, and again captured by tcpdump-uw. To avoid this, you can exclude SSH by using a expression filter. These commands are possible:
~ # tcpdump-uw -i vmk0 not port 22
~ # tcpdump-uw -i vmk0 not port ssh
~ # tcpdump-uw -i vmk0 not tcp port 22
To display packets with verbose detail, use the tcpdump-uw command with the -v, -vv or -vvv option. This command will display all packets on vmk0, except SSH connections to avoid a loop in verbose detail:
~ # tcpdump-uw -i vmk0 not port 22 -v
~ # tcpdump-uw -i vmk0 not port 22 -vv
~ # tcpdump-uw -i vmk0 not port 22 -vvv
Expressions can also be used to collect packets for a specific protocol only. The following command displays ICMP (ping) only:
~ # tcpdump-uw -i vmk0 icmp
By default tcpdump-uw captures only the first 68 bytes of data from a packet. To capture the entire packet, use the tcpdump-uw command and the -s option with a value of 1514.
~ # tcpdump-uw -i vmk0 -s 1514
When Jumbo Frames are enabled, use the tcpdump-uw command with the -s option and a value of 9014. Due to buffer constrains, tcpdump-uw can only capture a maximum of 8138 bytes. The -B 9 option increases the buffer to allow the capture of up to 9014 bytes.
~ # tcpdump-uw -i vmk0 -s 9014 -B 9
Write tcpdump packet traces to a file for later analysis.
~ # tcpdump-uw -w dump.cap
Expressions can also be used to display traffic from a single IP address only:
~ # tcpdump-uw -i vmk0 host x.x.x.x
You can combine expressions to further specify the filter. The following example limits the output to ICMP from a specific host:
~ # tcpdump-uw -i vmk0 icmp and host x.x.x.x
To filter unwanted traffic you can combine multiple traffic types. The following example filters ARP, SSH and DNS traffic:
~ # tcpdump-uw -i vmk0 not arp and not port 22 and not port 53
To exit tcpdump-uw after a given number of packets, use the -c option. This example will capture 10 packets and then quit:
~ # tcpdump-uw -i vmk0 -c 10
To save the dump in pcap format for later use with Wireshark or the -r option, use the -w [file] option. When you write dumps to a file for later analysis you should capture the entire packet with the -s 1514 option.
~ # tcpdump-uw -i vmk0 -s 1514 -w vmk0.pcap
For long time analysis you can split the outfile to smaller chunks with the -C [size] option.
~ # tcpdump-uw -i vmk0 -s 1514 -w vmk0.pcap -C 20M
To prevent running out of space you can limit the total number of outfiles with the -W option. In the following example, tcpdump-uw is limited to 10 chucks, each 20MB and will quit when the limit is reached.
~ # tcpdump-uw -i vmk0 -s 1514 -w vmk0.pcap -C 20M -W 10
Read captured traffic back into tcpdump-nw:
~ # tcpdump-uw -r vmk0.pcap
pktcap-uw Usage
The pktcap-uw tool allows to capture traffic that flows through physical network adapters, VMkernel interfaces, and virtual switch ports. As there are many possibilities, you can't run pktcap-uw without parameters like you know it from tcpdump-nw. It also comes with a self-explaining help page.
~ # pktcap-uw -h

Packet Capture and Trace command usage:
        == Create session to capture packets ==
         pktcap-uw [--capture  | [--dir <0/1>] [--stage <0/1>]
                [-K|--kernelside]]
            [--switchport  | --vmk  | --uplink  |
               --dvfilter ]
               --lifID ]
            [-f [module name.]]
            [-AFhP] [-p|--port ]
            [-c|--count ] [-s|--snapLen ]
            [-o|--outfile ] [--console]
            [Flow filter options]

        == Create session to trace packets path ==
         pktcap-uw --trace
            [-AFhP] [-p|--port ]
            [-c|--count ] [-s|--snapLen ]
            [-o|--outfile ] [--console]
            [Flow filter options]

The command options:
        -p, --port
                Specify the port number of vsocket server.
        -o, --outfile
                Specify the file name to dump the packets. If unset,
                output to console by default. If '-', then stdout is used.
        -P, --ng   (only working with '-o')
                Using the pcapng format to dump into the file.
        --console  (by default if without '-o')
                Output the captured packet info to console.
        -s, --snaplen
                Only capture the first  packet buffer.
                The minimum snap length is 24 bytes. However, setting
                snaplen to 0 will capture entire packet.
        -c, --count
                How many count packets to capture.
        -h
                Print this help.
        -A, --availpoints
                List all capture points supported.
        -F
                List all dynamic capture point functions supported.
        --capture
                Specify the capture point. Use '-A' to get the list.
                If not specified, will select the capture point
                by --dir and --stage setting

The switch port options:
(for Port, Uplink and Etherswitch related capture points)
        --switchport
                Specify the switch port by ID
        --lifID
                Specify the logical interface id of VDR port
        --vmk
                Specify the switch port by vmk NIC
        --uplink
                Specify the switch port by vmnic

The capture point auto selection options without --capture:
        --dir <0|1>  (for --switchport, --vmk, --uplink)
                The direction of flow: 0- Rx (Default), 1- Tx
        --stage <0|1>  (for --switchport, --vmk, --uplink, --dvfilter)
                The stage at which to capture: 0- Pre: before, 1- Post:After
        --kernelside (for --uplink)
                The capture point is in kernel instead of in driver

The capture point options
        -f [module name.]
                The function name. The Default module name is 'vmkernel'.
                (for 'Dynamic', 'IOChain' and 'TcpipDispatch' capture points)
        --dvfilter
                Specify the dvfilter name for DVFilter related points

Flow filter options, it will be applied when set:
        --srcmac
                The Ethernet source MAC address.
        --dstmac
                The Ethernet destination MAC address.
        --mac
                The Ethernet MAC address(src or dst).
        --ethtype
                The Ethernet type. HEX format.
        --vlan
                The Ethernet VLAN ID.
        --srcip
                The source IP address.
        --dstip
                The destination IP address.
        --ip
                The IP address(src or dst).
        --proto 0x
                The IP protocol.
        --srcport
                The TCP source port.
        --dstport
                The TCP destination port.
        --tcpport
                The TCP port(src or dst).
        --vxlan
                The vxlan id of flow.
pktcap-uw Examples
To capture packets from VMkernel interfaces use the vmk option.
~ # pktcap-uw --vmk vmk0
When you run the command above in a SSH session you create a loop. Each captured packet is transfered to your workstation, and again captured by pktcap-uw. So you can't liveview vmkports that way with pktcap-uw, you have to be more specific.
Capture VMkernel Interface packets from a specific IP address:
~ # pktcap-uw --vmk vmk0 --ip x.x.x.x
pktcap-uw can only capture traffic at one capture point, incoming or outgoing. The default is to capture packets from the VMkernel adapter to a port on the virtual switch. To capture the other direction you have to specify the capture point:
~ # pktcap-uw --vmk vmk0 --ip x.x.x.x --capture PortOutput
Capture VMkernel Interface packets from a specific port (443):
~ # pktcap-uw --vmk vmk0 --tcpport 443
To save packets in pcap format for later use with Wireshark use the -o option.
~ # pktcap-uw --vmk vmk0 --tcpport 443 -o vmk0.pcap
Capture VMkernel Interface packets from a specific protocol, ICMP (List of IP protocol numbers):
~ # pktcap-uw --vmk vmk0 --proto 0x01
Capture physical NIC traffic
~ # pktcap-uw --uplink vmnic0
To capture Virtual Machine traffic you have to know the Port-ID. Works with both, distributed and standard switches. To identify the Port-ID open esxtop and press n.
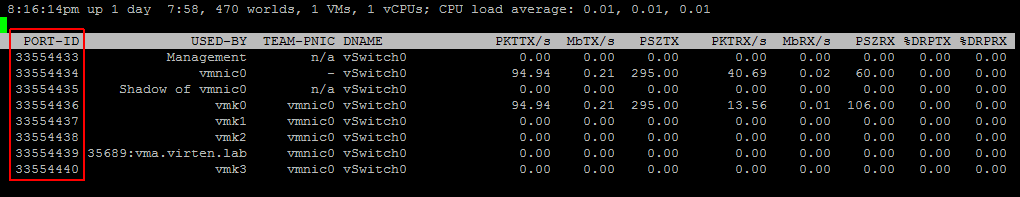
Use the Port-ID (33554439) of the virtual machines network interface to capture the traffic
~ # pktcap-uw --switchport 33554439
Like all other commands, the concept of capture points also apply here. To capture traffic that goes inside the virtual machine, use this command:
~ # pktcap-uw --switchport 33554439 --capture PortOutput
To capture any dropped packets use this command:
~ # pktcap-uw --capture Drop
The pktcap-uw utility is strictly bound to the concept oif capture points. These capture points do exist:
~ # pktcap-uw -A
Supported capture points:
 1: Dynamic -- The dynamic inserted runtime capture point.
 2: UplinkRcv -- The function that receives packets from uplink dev at driver side
 3: UplinkSnd -- Function to Tx packets on uplink at driver side
 4: VnicTx -- Function in vnic backend to Tx packets from guest
 5: VnicRx -- Function in vnic backend to Rx packets to guest
 6: PortInput -- Port_Input function of any given port
 7: IOChain -- The virtual switch port iochain capture point.
 8: EtherswitchDispath -- Function that receives packets for switch
 9: EtherswitchOutput -- Function that sends out packets, from switch
 10: PortOutput -- Port_Output function of any given port
 11: TcpipDispatch -- Tcpip Dispatch function
 12: PreDVFilter -- The DVFIlter capture point
 13: PostDVFilter -- The DVFilter capture point
 14: Drop -- Dropped Packets capture point
 15: VdrRxLeaf -- The Leaf Rx IOChain for VDR
 16: VdrTxLeaf -- The Leaf Tx IOChain for VDR
 17: VdrRxTerminal -- Terminal Rx IOChain for VDR
 18: VdrTxTerminal -- Terminal Tx IOChain for VDR
 19: PktFree -- Packets freeing point
 20: TcpipRx -- TcpipRX function
 21: TcpipTx -- TcpipTX function
 22: UplinkRcvKernel -- The function that receives packets from uplink dev at kernel side
 23: UplinkSndKernel -- Function to Tx packets on uplink at kernel side
Some capture points are bound to specific traffic types (Virtual Machine traffic, VMkernel traffic,..) and some are global. The full list is documented here.
Very well explains.
Very nice post - many thanks for doing it!
Thanks Florian and sorry for resurrecting this article.
I habe a few additions which might be interesting for some people:
1. In order to have human-readable output for pktcap-uw I use tcpdump-uw for pcap-interpretation only like this
[root@esx1:~] pktcap-uw --dir 2 --uplink vmnic0 -o - | tcpdump-uw -r - "icmp or port 443"
But beware: Specifying filters for tcpdump-uw only means pktcap-uw will capture all packets and all of them are piped to tcpdump-uw and will be filtered only at the end which might put an unneccessary burden on the host
2. To find out the port number for the VMs, the tool "net-stats" comes in handy:
[root@esx1:~] net-stats -l
PortNum Type SubType SwitchName MACAddress ClientName
2214592520 4 0 DvsPortset-0 34:64:a9:9a:3a:f1 vmnic1
67108876 5 7 DvsPortset-0 00:50:56:95:d2:f0 VM1.eth0
67108877 5 9 DvsPortset-0 00:50:56:d7:42:74 VM2.eth0
2248146950 4 0 vSwitch0 34:64:a9:9a:3a:f0 vmnic0
100663306 3 0 vSwitch0 34:64:a9:9a:3a:f0 vmk0
100663307 3 0 vSwitch0 00:50:56:61:73:8f vmk1
And one wish:
I would really appreciate an article on "NSX-T packet capturing on the commandline".
like "set session capture" and "start capture" on the edge nodes, nsxcli start capture on the esx hosts and so on.
Thanks man, interpreting pktcap-uw was exactly what I was trying to do and your comment saved the day!
Hey man. I don't think you can pipe the output of pktcap-uw to tcpdump-uw. I just tried it on ESXI 7.0.
I had to do the command separately, eg:
pktcap-uw --dir 2 --uplink vmnic0 -o filename.pcap
tcpdump-uw -r filename.pcap "icmp or port 443"
Not a big issue :)
Hi Paul,
this was not just speculation on my side. This is the way I have been doing it for a few years at least.
Piping directly from pktcap-uw to tcpdump-uw works without problems, just try it.
At least I never had real problems with it.
What was the error message you got and what did your command line look like?
But of course there are some caveats:
1. If you generously capture on an uplink (physical) interface and perform filtering only on the right hand side of the pipe (on tcpdump-uw only), there will propably be a lot of data put through the pipe in order to be dropped at the other end because the tcpdump filter says so. It is advisable for performance reasons to filter as much traffic already with pktcap-uw. Unfortunately it does not use the pcap filter syntax we all are familar with.
2. Other stdout data would also be piped to tcpdump-uw. But from my experience if the -o option is specified pctcap-uw uses STDOUT for pcap-data only and informative output and error messages are sent to STDERR ans thus displayed normally.
This is very well done, thank you for putting this together!