For network analysis I want to have Distributed Switch port statistics in my Graphite installation. I’ve created a script that pulls dvSwitch port statistics from a vCenter server, or directly from an ESXi host and sends them to a Carbon Relay. Ports connected to NSX Logical Switches, which are actually distributed Port Groups, are also included. This allows to create universal dashboards with Grafana for example.
This script is intended to run as cronjob every minute. Port Statistics are provided as counters which can be easily converted to per second values with Graphite functions.
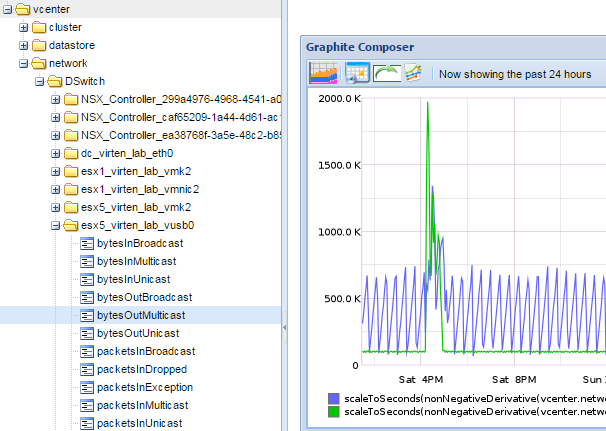
The following metrics are available per port:
- bytesInBroadcast - The number of bytes received from broadcast packets.
- bytesInMulticast - The number of bytes received from multicast packets.
- bytesInUnicast - The number of bytes received from unicast packets.
- bytesOutBroadcast - The number of bytes forwarded from broadcast packets.
- bytesOutMulticast - The number of bytes forwarded from multicast packets.
- bytesOutUnicast - The number of bytes forwarded from unicast packets.
- packetsInBroadcast - The number of broadcast packets received.
- packetsInDropped - The number of received packets dropped.
- packetsInException - The number of packets received that cause an exception.
- packetsInMulticast - The number of multicast packets received.
- packetsInUnicast - The number of unicast packets received.
- packetsOutBroadcast - The number of broadcast packets forwarded.
- packetsOutDropped - The number of packets to be forwarded dropped.
- packetsOutException - The number of packets to be forwarded that cause an exception.
- packetsOutMulticast - The number of multicast packets forwarded.
- packetsOutUnicast - The number of unicast packets forwarded.
Transform total metrics to "x per Minute"
All metrics are total counters which means that they look like this in Graphite:
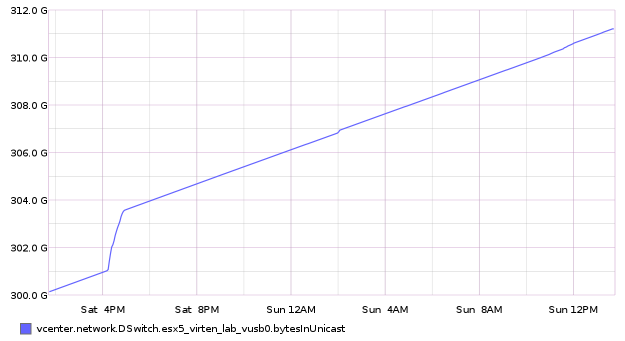
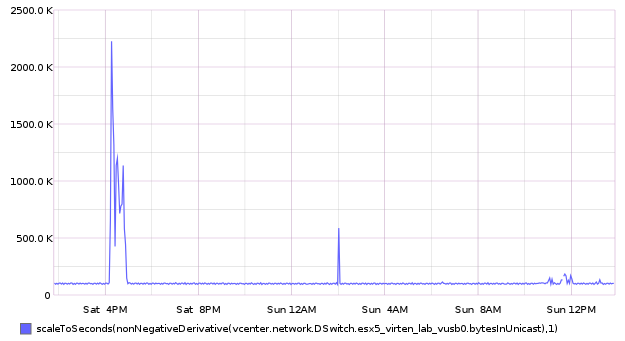
To convert them to a rate, two Graphite functions are required. nonNegativeDerivative() calculates the delta between subsequent data points and scaleToSeconds() converts the result to a per second value.
After applying both functions, the graph displays per second values:
scaleToSeconds(nonNegativeDerivative([metric]),1)
Refresh dvPort state
When the script runs with a vCenter Server, the following Task appears during each collection:
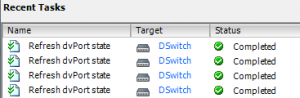
This is required because the vCenter Server does not actively monitor all port states. As a prerequisite to receive the latest values the script refreshes dvPort states. The only solution to get rid of these messages is to run the script against all ESXi hosts separately. This script produces the same result when running against an ESXi host, but only ports active on the respective host are available.
The script is available in my GitHub Repository
Download: dvswitch-graphite.pl