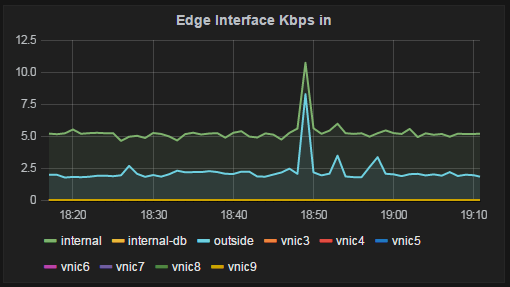
To monitor VMware NSX Edge Gateways I want to send interface statistics to my Graphite installation. NSX Manager comes with a REST API that allows to pull information in XML or JSON format. I've created a script that pulls Interface, Firewall and Load Balancer statistics from all ESGs and sends them to a Carbon Relay. This allows to create universal custom dashboards with Grafana for example.
This script is intended to run as cronjob every minute. Statistics provided by NSX REST API are in 20s intervals with their corresponding timestamp.
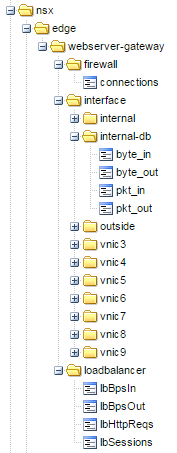
The script pulls data from the following source:
- /api/4.0/edges/[edgeId]/statistics/dashboard/interface
- /api/4.0/edges/[edgeId]/statistics/dashboard/firewall
- /api/4.0/edges/[edgeId]/statistics/dashboard/loadbalancer
Configuration:
- $nsxUsername - NSX Manager Username
- $nsxPassword - NSX Manager Password
- $nsxMgt - NSX Manager Hostname/IP
- $prefix - Metric Prefix used in Graphite
- $carbonServer - Carbon Relay (Graphite) Hostname/IP
- $carbonPort - Carbon Relay Port
- $debug - Prints statistics, instead of sending them to Graphite
Metrics created by the script:
Download: nsx-edge-graphite.pl (GitHub)
Hello.
Can you help me?
I use NSX 6.3.2.
How I can get statistics in Grafana?
Maybe you know.
Thx for your time.