 Cooling the Raspberry Pi 4 is highly recommended, not only when running the ESXi-Arm Fling. The Raspberry Pi 4 has an internal temperature sensor, which is used to ensure that temperature does not exceed 85°C. When the temperature is at about 82°C, the system automatically reduces the clock speed to prevent the system from overheating. This mechanism is also referred to as "Thermal Throttling".
Technically, it is not required to install heatsinks or small fans to prevent it from overheating. But if you want to have the system to run at full performance, you definitely want to install heatsinks and a fan. Of course, running the system as cool as possible will also increase its overall lifespan.
That's the theory - But is Thermal Throttling working with the ESXi-Arm? And how can you identify that the clock speed has been reduced? Let's find out...
For this test I'm using the following configuration:
- Raspberry Pi 4 Modell B - 8 GB - ARM-Cortex-A72 4 x 1.50 GHz
- Copper Heatsink
- EEPROM 2020-09-03-vl805-000138a1
- RPi4 UEFI Firmware v1.20
- VMware ESXi 7.0.0 build-17068872 (ESXi 7.0 for ARM Fling v1.1)
- Native ESXi on Arm hardware status driver (thpimon-0.1.0)
ESXi is already installed. To monitor the temperature, I'm using the Native ESXi on Arm hardware status driver and sending the Temperature to Graphite every 10 seconds. To see when the Raspi is throttling, I'm also sending the ESXi hosts cpu.usagemhz.average value to Graphite. This is the value I'm expecting to decrease when running into thermal throttling.
For visualization, I'm using Grafana: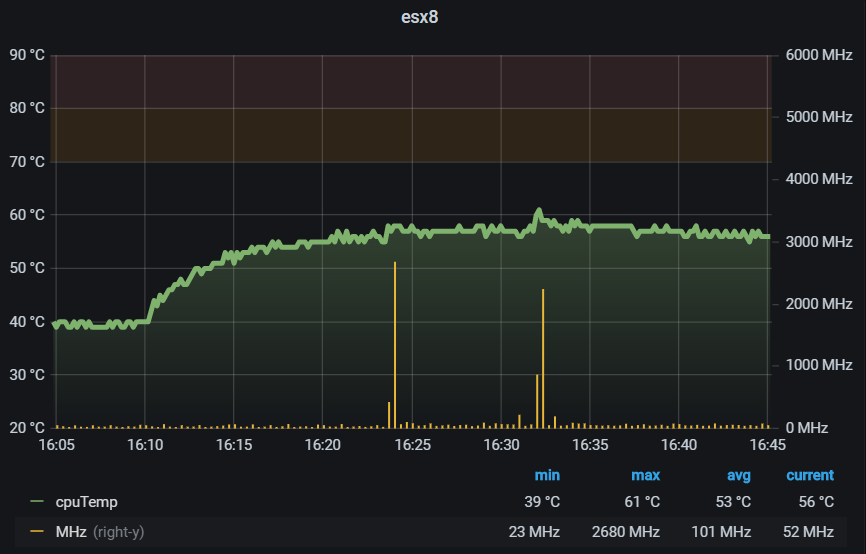
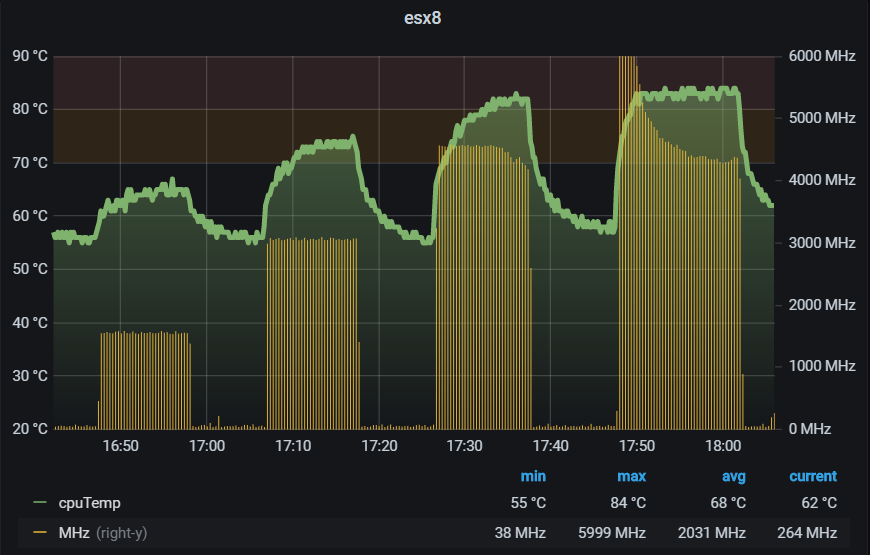
Left Y-Axis: CPU Temperature. There is a warning threshold at 70°C and a critical at 80°C.
Right Y-Axis: ESXi Usage in MHz (cpu.usagemhz.average). The Limit is 6GHz (4x 1.5 GHz)
To get the idle temperature, I've removed the fan at 16:10. You can see that the temperature changes from 40°C to 56°C, which is the baseline for my tests. The ambient temperature (Measured with a DHT22) is 24.5°C.
For the stress tests, I've created a Virtual Machine running Raspberry Pi OS (Buster) with 4 Virtual CPUs. To create CPU Load, the tool stress-ng is used. This allows me to run repeatable tests with a fixed set of CPU instructions. I'm using the CPU Method "Fast Fourier Transform" (fft) with 250000 CPU operations per CPU. Each run should last about 10 minutes. The fixed set of instructions also allows me to see how thermal throttling increases the runtime.
/usr/bin/stress-ng --cpu 1 --cpu-method fft --cpu-ops 250000 --metrics-brief
/usr/bin/stress-ng --cpu 2 --cpu-method fft --cpu-ops 500000 --metrics-brief
/usr/bin/stress-ng --cpu 3 --cpu-method fft --cpu-ops 750000 --metrics-brief
/usr/bin/stress-ng --cpu 4 --cpu-method fft --cpu-ops 1000000 --metrics-brief
The first two tests with 1 CPU (25% load) and 2 CPU (50% load) did not result in thermal throttling. With the system being hat 50% of its capacity (3 GHz), the temperature was at 75°C. That is very close to the threshold, so I expect the next test to run into thermal throttling. Both tests are running roughly 650 seconds, which is very close to the expected runtime.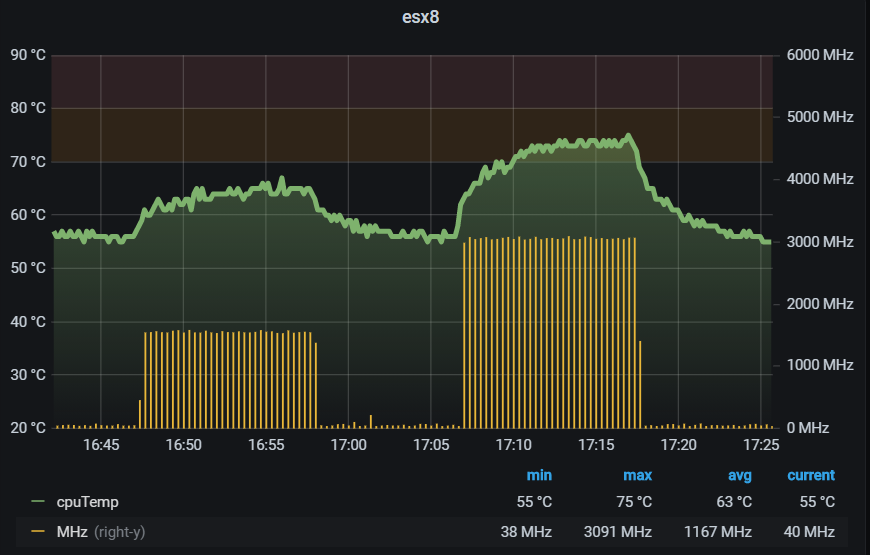
The third test runs with 3 CPU (75% load). After 8 minutes into the test, the first signs of thermal throttling are visible. With the temperature hitting 83°C, the clock speed is lowered and the temperature did not increase further. The runtime increased from 652 to 669 seconds, which is an increase of 3%. The average bogo ops/s per CPU dropped from 385 to 375.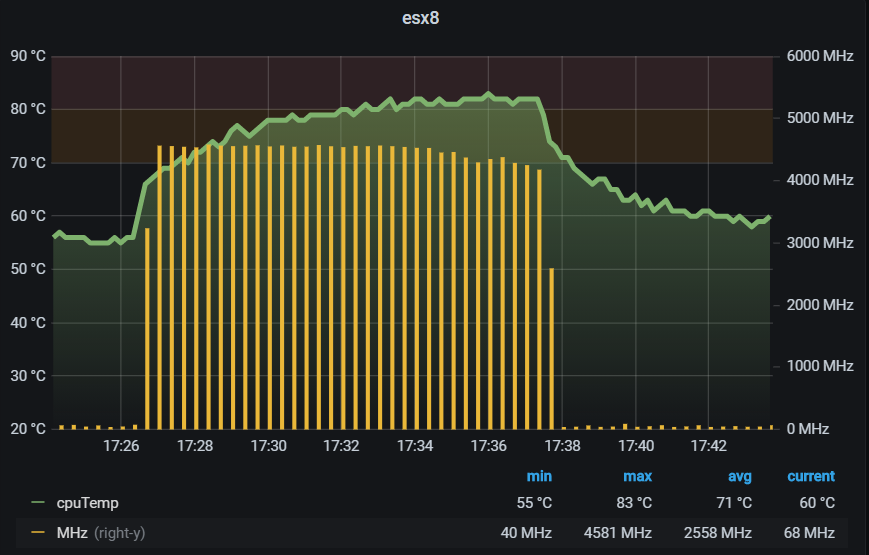
The last test runs with 4 CPU (100% load). It took only 2 minutes to run into thermal throttling and the CPU clock speed is decreased to 4.25 GHz, which is about 70% of the Raspis total performance. The runtime increased to 868 seconds (+30%) and the average bogo ops/s per CPU dropped to 290.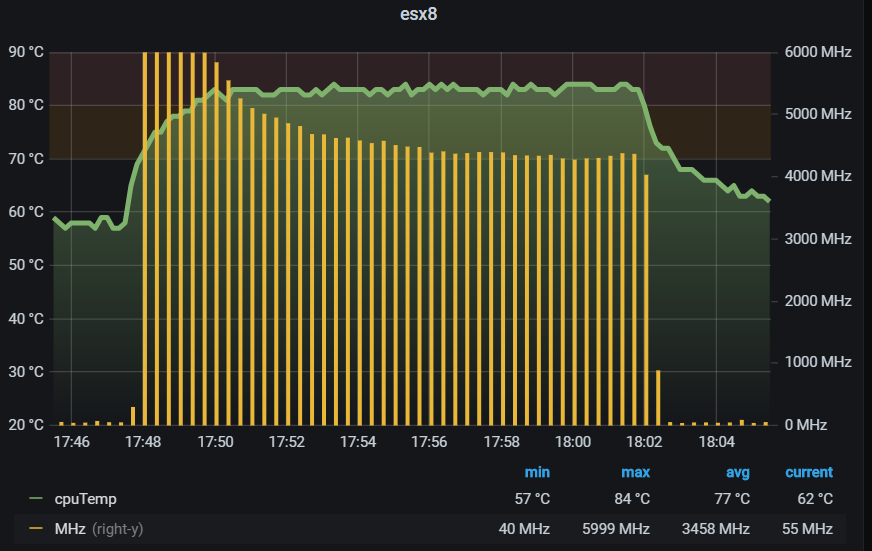
Here are the final results of all tests combined:
| CPU Load | Throttling | Max Temp | Total bogo ops/s | Runtime |
| 25% | NO | 67 °C | 389,04 | 642 seconds |
| 50% | NO | 74 °C | 770,81 | 652 seconds |
| 75% | YES | 83 °C | 1125 | 669 seconds |
| 100% | YES | 83 °C | 1161 | 868 seconds |
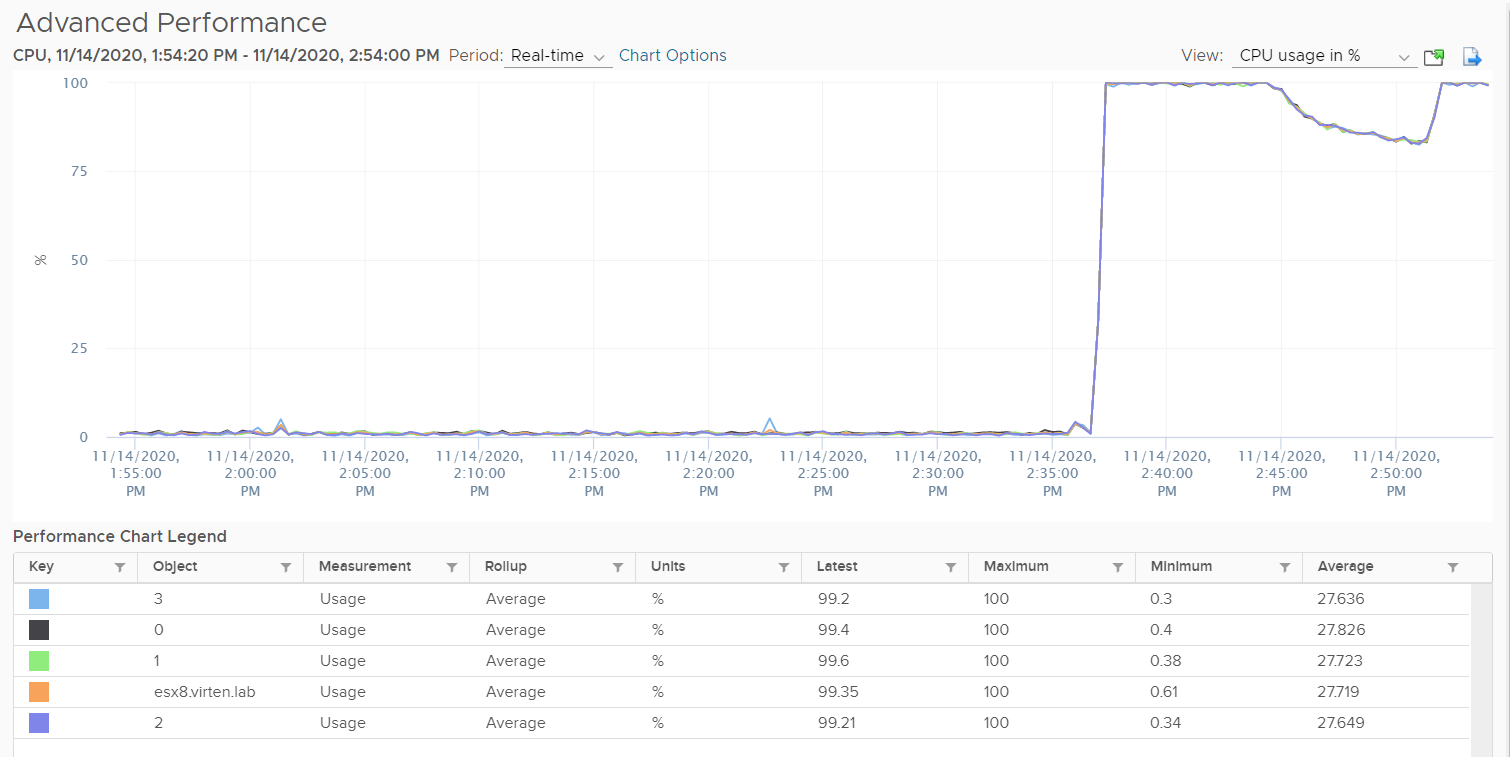
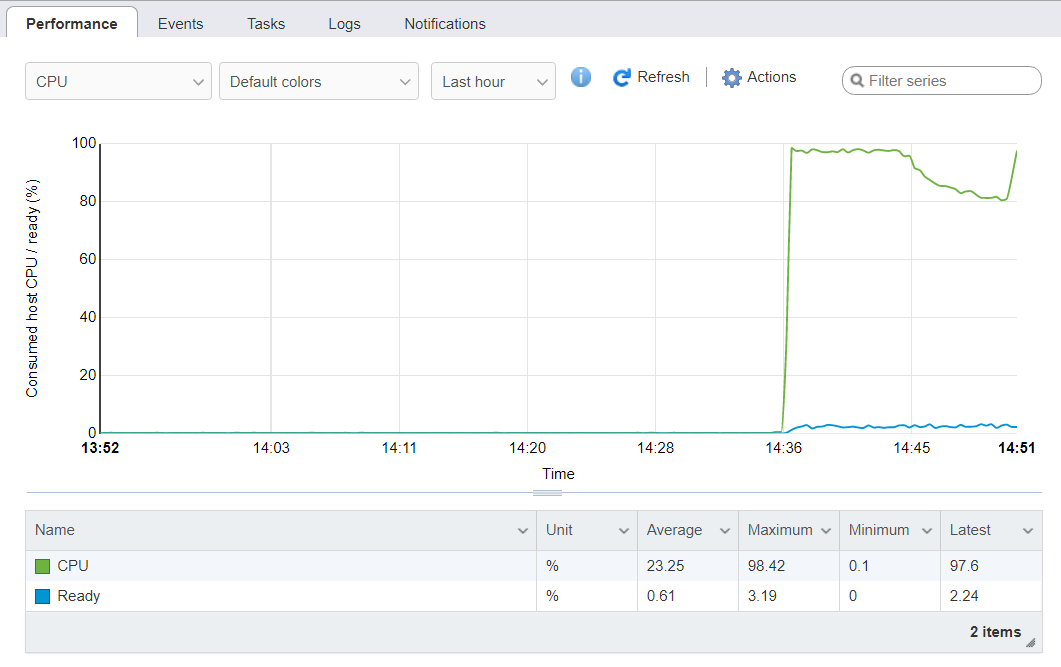
As you can see, thermal throttling works fine with the ESXi-Arm. And there are other options for you to verify the reduced clock speed. In esxtop, you see a decrease in %USED, compared to %RUN and %UTIL, when the clock speed is reduced. When looking at performance statistics in vCenter Server, you see a decrease in CPU Usage.


Great post. Thanks for doing this.