With vSphere 8.0, a couple of new performance counters have been implemented in vCenter Server. When you migrate a Virtual Machine to another Host, the hostd service running on the ESXi Host keeps track of performance statistics from the vMotion process. These statistics can now be viewed in the vSphere Clients performance pane.
To monitor the vMotion process and the resulting downtimes, you usually have to check the virtual machines vmware.log or the ESXi Hosts hostd.log. Here is an example from a finished migration in the hostd.log:
2023-01-08T08:49:42.153Z In(166) Hostd[1836473]: [Originator@6876 sub=Vcsvc.VMotionSrc.6678473373419715679] Vmotion task succeeded with result: (vim.host.VMotionManager.SrcVM
otionResult) {
2023-01-08T08:49:42.153Z In(166) Hostd[1050266]: -->    vmDowntime = 21669,
2023-01-08T08:49:42.153Z In(166) Hostd[1050266]: -->    vmPrecopyStunTime = 100557,
2023-01-08T08:49:42.153Z In(166) Hostd[1050266]: -->    vmPrecopyBandwidth = 115387000,
2023-01-08T08:49:42.153Z In(166) Hostd[1050266]: -->    srcMigrationTime = 128762384,
2023-01-08T08:49:42.153Z In(166) Hostd[1050266]: -->    latencyAware = true,
2023-01-08T08:49:42.153Z In(166) Hostd[1050266]: -->    vmotionRTT = 116,
2023-01-08T08:49:42.153Z In(166) Hostd[1050266]: -->    isVmotionAtHighRTT = 0,
2023-01-08T08:49:42.153Z In(166) Hostd[1050266]: -->    svmDiskXferRate = (long) [
2023-01-08T08:49:42.153Z In(166) Hostd[1050266]: -->       -1,
2023-01-08T08:49:42.153Z In(166) Hostd[1050266]: -->       -1,
2023-01-08T08:49:42.153Z In(166) Hostd[1050266]: -->       -1,
2023-01-08T08:49:42.154Z In(166) Hostd[1050266]: -->       -1
2023-01-08T08:49:42.154Z In(166) Hostd[1050266]: -->    ],
2023-01-08T08:49:42.154Z In(166) Hostd[1050266]: -->    svmMinDiskXferRate = -1,
2023-01-08T08:49:42.154Z In(166) Hostd[1050266]: -->    svmMaxDiskXferRate = -1,
2023-01-08T08:49:42.154Z In(166) Hostd[1050266]: -->    memPrecopyTime = 128733569,
2023-01-08T08:49:42.154Z In(166) Hostd[1050266]: -->    diskPrecopyTime = 0,
2023-01-08T08:49:42.154Z In(166) Hostd[1050266]: --> }
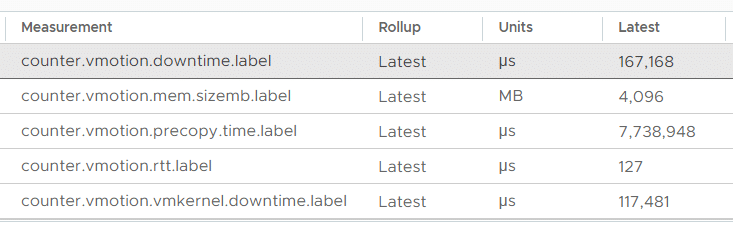
These statistics are now available to be viewed in the vSphere Clients Performance Manager. The following new vMotion-related metrics are available in vSphere 8 per Virtual Machine:
| vmotion.downtime.latest | vMotion Switchover Downtime (µs) Switchover downtime is the timespan in microseconds after the pre-copy phase when the virtual machine is stunned on the source host until it is resumed on the destination host. This virtual machine downtime is required to ensure no pages are changed in the switchover phase. It is usually less than 0.5 seconds. |
| vmotion.dst.migration.time.latest | vMotion Task Time (s) The migration time is in seconds from the start to finish of the vMotion Task. Most of the time, in the pre-copy phase, the virtual machine can be used as usual. |
| vmotion.mem.sizemb.latest | vMotion Task Size (MB) Size to transfer in Megabytes. This is usually the configured Memory of the virtual machine. |
| vmotion.precopy.time.latest | vMotion Pre-Copy Phase Duration (µs) The Pre-Copy phase is an iterative process where the virtual machine memory is copied to another ESXi Host. The first iteration copies the entire memory. All subsequent iterations copy dirty (changed) pages, until the final iteration where the process assumes that it will fit in 500 milliseconds. |
| vmotion.rtt.latest | Round Trip Time (µs) Network latency between source and destination ESXi Host. |
| vmotion.vmkernel.downtime.latest | vMotion Switchover Downtime reported by VMkernel (µs) Switchover downtime is the timespan in microseconds after the pre-copy phase when the virtual machine is stunned on the source host until it is resumed on the destination host. This virtual machine downtime is required to ensure no pages are changed in the switchover phase. It is usually less than 0.5 seconds. This is the time reported by VMkernel that can also be viewed in hostd.log. |
Unfortunately, the metrics are not enabled by default. They also have no proper description so I assume they are currently intended as Technology Preview. To see the metrics, you have to change the counter level to 1, which is only possible using the API. The Counter Level is a parameter that allows you to specify which metrics are stored in the vCenters Database.
The easiest way to change collection levels is by using VMwares LevelMappingUtility which is available in KB2009532.
Create a CSV File with the following content (vmotionMetrics.csv):
#TYPE VMware.VimAutomation.PowerCliExtensions.CounterLevelMapping,,,
Name,AggregateLevel,PerDeviceLevel,Server
vmotion.downtime.latest,1,1,vcenter.example.com
vmotion.dst.migration.time.latest,1,1,vcenter.example.com
vmotion.mem.sizemb.latest,1,1,vcenter.example.com
vmotion.precopy.time.latest,1,1,vcenter.example.com
vmotion.rtt.latest,1,1,vcenter.example.com
vmotion.vmkernel.downtime.latest,1,1,vcenter.example.com
Then use the LevelMappingUtility from KB2009532 to set the values:
PS> Import-Module VMware.VimAutomation.PowerCliExtensions.CounterLevelMapping.psm1
PS> Connect-VIServer vcenter.example.com
PS> Import-csv -path cmotionMetrics.csv | Set-PxCounterLevelMapping -Server vcenter.example.com
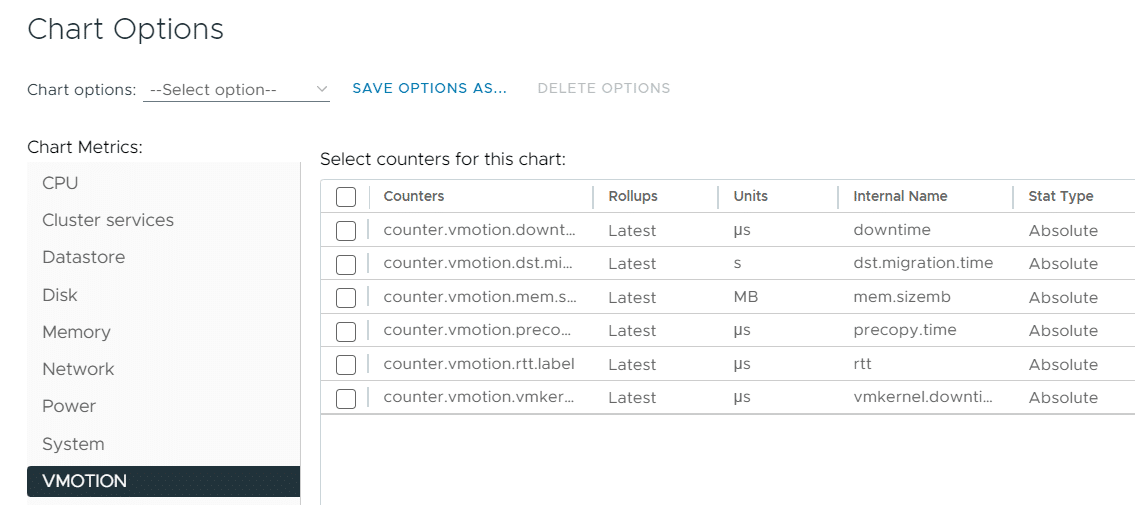
"VMOTION" Chart Metrics should now appear in the Advanced Performance Chart Options:
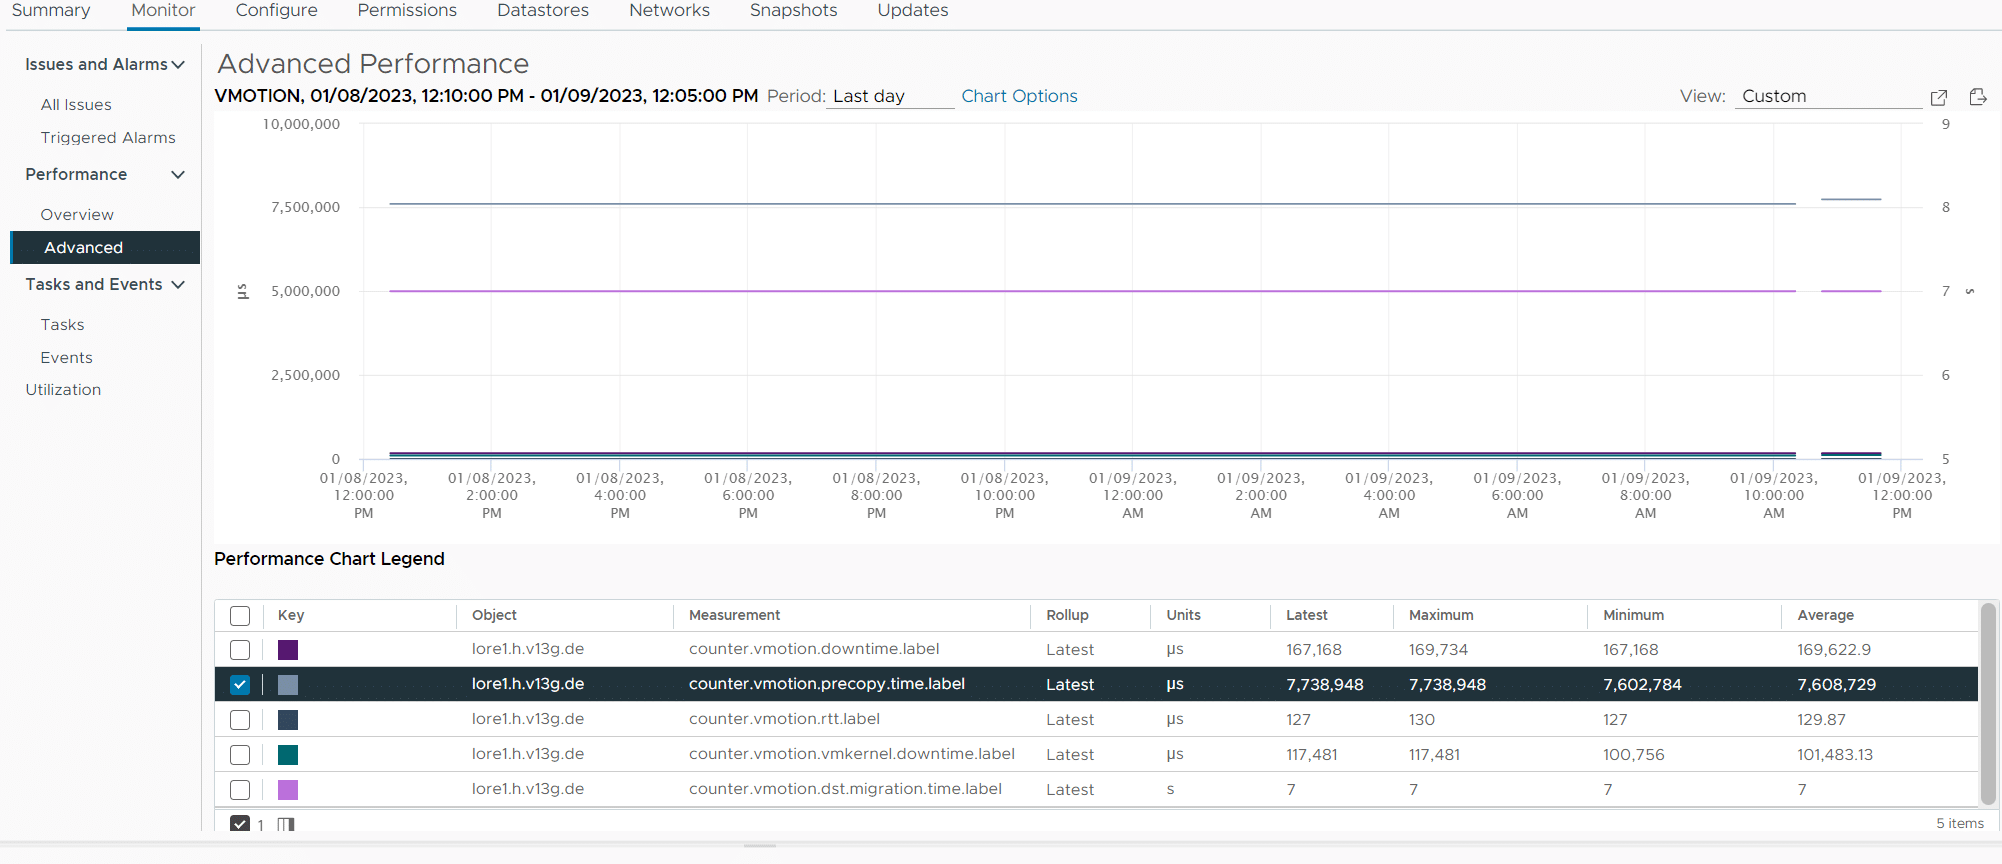
As you might imaging, a value that only changes after a vMotion does not look great as a line Graph. But it's nice to have it:
Hi, I have tried this, in 8.0.3 no luck, I assume I was supposed to look at the host level advance performance?