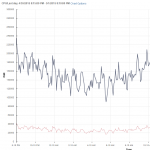
 When analysing performance metrics in the vSphere Web Client (Monitor > Performance) or in the vSphere Client (Performance Tab) you might have seen the following messages instead of performance graphs:
"No data available"
"Data is not collected for the current statistics level. Increase the statistics level to view the graph."
Statistic parameters are "Interval Duration" and "Statistics Level". This is what you configure in the vCenter Server settings:

Interval Duration determines the frequency at which statistics are stores:
- Realtime (20 seconds), save for 1 hour - not configurable, all metrics available
- 5 minutes, save for X days
- 30 minutes, save for X weeks
- 2 hours, save for X month
- 1 day, save for X month
Statistic Level determines the amount of data gathered and which counters are available for displayed. The default Level 1 stores the fewest metrics, Level 4 stores all metrics supported by the vCenter Server.
With vSphere 6.0, vCenter Server supports 544 metrics but as there are only 4 statistic levels it is not clear what metrics are included in each level. This post helps to understand what metrics are included in each level, and how you can add single metrics to lower levels. This might be helpful if you need single metrics from level 2, but do not want to activate all level 2 metrics.
Please note that changing the collection level beyond level 1 or adding a large number of data counters to collection level 1, might result in a significant reduced performance.
Read More »Which Performance Counters are available in each Statistic Level?


 When analysing performance metrics in the vSphere Web Client (Monitor > Performance) or in the vSphere Client (Performance Tab) you might have seen the following messages instead of performance graphs:
 This is a list of all available performance metrics that are available in vSphere vCenter Server 6.0. Performance counters can be views for Virtual Machines, Hosts, Clusters, Resource Pools and other objects by opening Monitor > Performance in the vSphere Web Client.