Whenever I evaluate a new storage hardware or technology, I do some basic performance testing with VMware I/O Analyzer. I/O Analyzer is virtual appliance (Fling) provided by VMware that runs Iometer to generate synthetic I/O workloads. After installing PernixData FVP my first idea was to compare the raw performance of my storage, against the performance with PernixData FVP. However, I quickly noticed that synthetic workloads do not create any useful results. The upside is that I've learned much about how their caching operates so I'm publishing my results anyway. Actually, it's not a problem with PernixData FVP itself, it's just how host based caching works.
Conclusion: Don't use synthetic workloads to test caching solutions! PernixData FVP works as expected but synthetic I/O workloads are no meaningful benchmarks for host based caching. I am going to test with realworld applications in another article to show how they can take advantage of FVP.
Testbed
I've tested PernixData FVP in my Homelab. No enterprise stuff, but that's one benefit of FVP - It works with any hardware:
- Server: 5th gen Intel NUC (NUC5I5MYHE) running ESXi 6.0 Update 2 (Build: 3620759)
- Storage: HP Microserver N40L running FreeNAS providing iSCSI Datastores
- PernixData FVP Management Server 3.1.010920.4
- PernixData FVP Host Extension 3.1.0.4-39343
- Acceleration Resource: Samsung 850 EVO M.2 250GB SSD
- VMware I/O Analyzer 1.6.2 (Configured with a 25GB workingset disk)
Write Acceleration (8k / 100% Write / 100% Random)
The first workload is configured with small random write blocks and runs 300 seconds. The following results are guest-level statistics generated by I/O Analyzer:
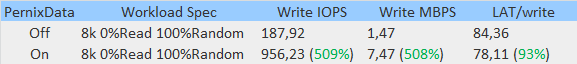
According to this table, the total write performance has been increased by 500%. Good result so far, but these values are misleading. The shorter a test runs, the better are the results. Write IOPS in a 30 seconds test are increased by 800% for example.
Backend Write IOPS measured on my Storage systems shows the following results. Both workloads create an almost identical profile, but with active FVP (red) the load lasts 1060 seconds, instead of 300 seconds, which was the actual test length.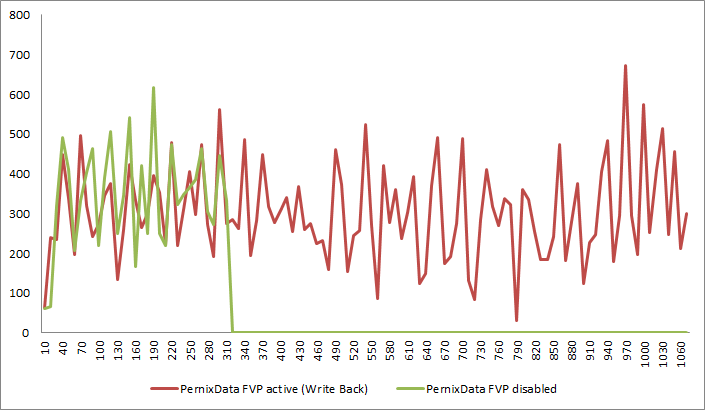
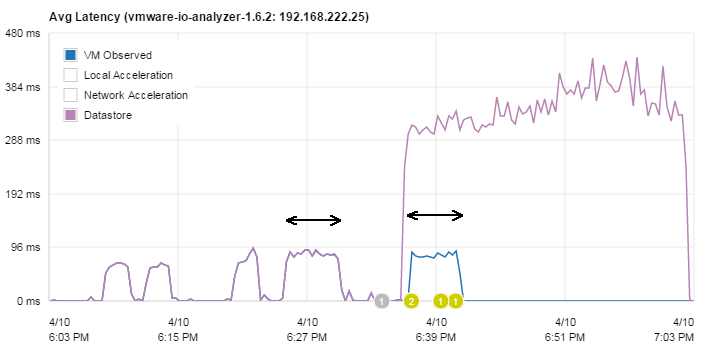
With PernixData Architect the timeline can be viewed from both perspectives, the VMs and the Datastores. This reveals why results are better, the shorter a test runs. When the test is started, it takes full advantage of the SSD performance for a few seconds. Then the Virtual machine enters flow control which slows the VM down to the backend storage performance.
 Why flow control? Is that bad? Can we disable it? Well, No! Data needs to be written to the storage at sometime. We can't cache it forever. However, typical production workloads are not constant write streams, but high IO spikes. And these spikes can be perfectely accelerated by FVP.
That basically shows how PernixData FVP write acceleration works. No magic. It acknowledges writes very fast, caches them locally (or with N+x redundancy across multiple ESXi hosts, which is one of their unique selling points) and destages them afterwards to the storage array. A very important fact here is that in flow control mode, VMs are not slowed down more than the actual storage performance. This can be verified when comparing the latency from both tests. Despite the Datastore latency grows massively, the VM Observed latency stays at the same level.
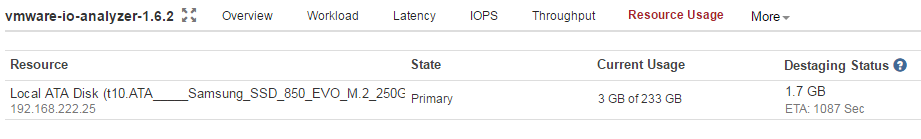
While the destaging status is transparent for the virtual machine, it can be viewed and analysed in PernixData Architect. The Acceleration Resource destages cached writes as fast as possible and estimates the remaining time in "Destaging Status". Currently, there are 1,7GB left to destage which takes about 18 minutes to finish. (This is something you shouldn't see in production for a long time period)
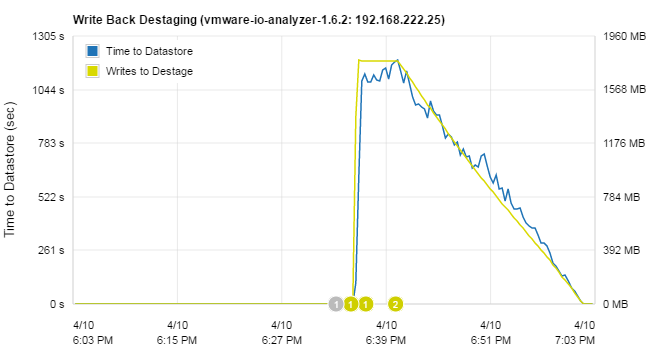
The Write Back Destaging status is also available as a graph, giving you the ability to analyse the cache saturation throughout the day.
I've done the same test with different block sizes without any differences to the result. FVP caching does what the SSD delivers. Very high number of IOPS with small blocks and high bandwidth with large blocks. Until flow control starts to slow down the virtual machine, it operates at full SSD performance.
During later tests I've created this chart which is a little bit zoomed in so you can see the lowered latency during the first minute of the performance test.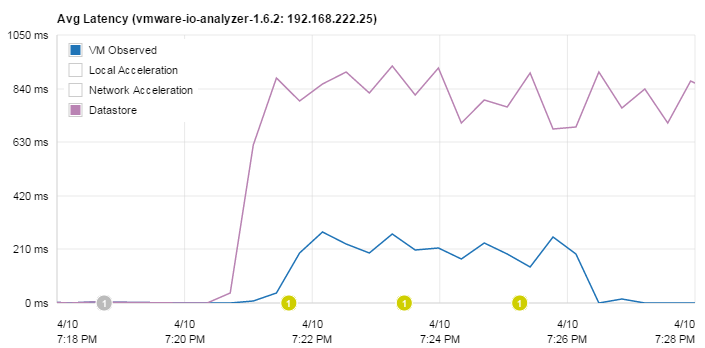
The problem here is that when writes are getting faster because they are cached, Iometer just generates more writes until it hits the limit and flow control starts to slow down the traffic. That's not how a real application workload looks like. When writes are faster, the application is happy but it does not create additional synthetic writes.
Read Acceleration
The second workload is configured with small sequential read blocks and runs 120 seconds. First with disabled FVP:
--> 3662,73 IOPS / 28,62 MBPS
Enabled FVP and started a second run:
--> 3568,62 IOPS / 27,88 MBPS
No acceleration at all. Is there something wrong? Started a third run:
--> 7007,32 IOPS / 54,74 MBPS
Much better. But what happened? As I started the first FVP enabled run there were no "hot" data in the cache, and thus there was nothing to accelerate. But during the first run, the cache was also filled so when I started the second FVP enabled run, it had all blocks from the first run on the local SSD which results in a nearly doubled performance.
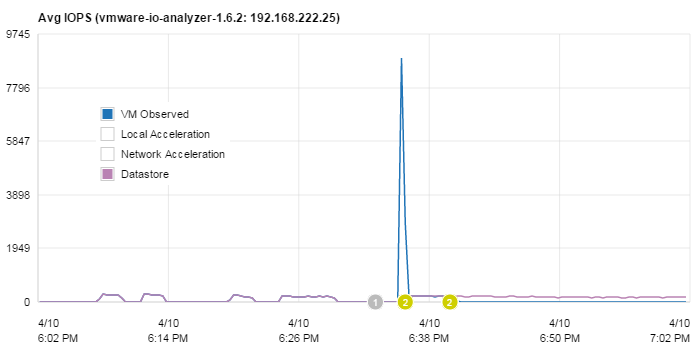
A closer look at the timeline reveals that the performance was actually not doubled. During the first seconds of the test, where blocks are served from the cache, it performed with over 42000 IOPS and a latency of 0,2 milliseconds. 
At some time, when the end of cached data is reached, the performance falls back to storage performance. During this phase, new blocks are again written to the cache:
![]()
Obviously, running the test more often results in better and better performance because after each test, more blocks are read from the storage and stored in the local cache. I've done 10 runs to show the effect:
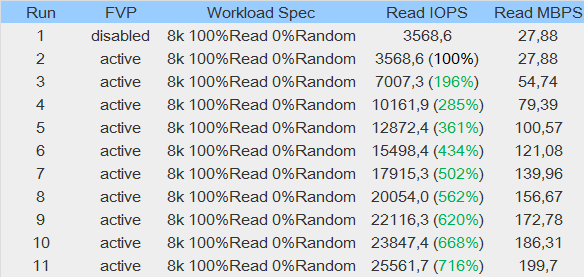
After 10 Tests, the cache did not reach the full capacity. It was at about 18GB, from my 25GB virtual disk. With PernixData Architect the result can be nicely visualised. VM observed IOPS are increased with every run. Just a few more tests and the 25GB disk is fully cached.
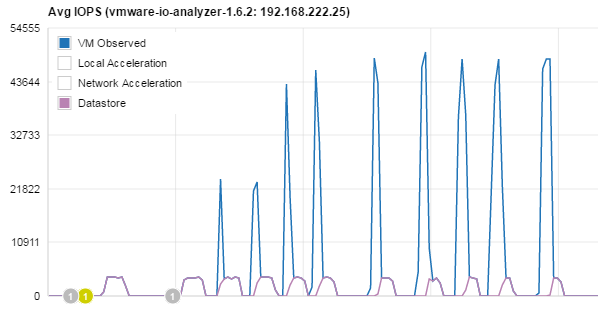
Beside the increased IOPS and bandwidth, the latency is reduced. I've marked some of the sections where blocks are served from the cache.

What is the result of the read test? Does PernixData FVP accelerate read IOPS by 0% or 616%? Actually, the result is: Don't use synthehic workloads to test caching solutions!
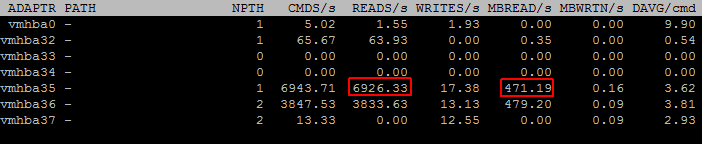
During the read tests I also used esxtop to see what happend under the hood. Disk Adapter Mode (d) provides good insights:
- vmhba35: SSD Controller (Local Cache Traffic)
- vmhba36: pernixgateway
- vmhba37: iSCSI (Remote Storage Traffic)
When blocks are read from the shared storage, they are also written to the local SSD:
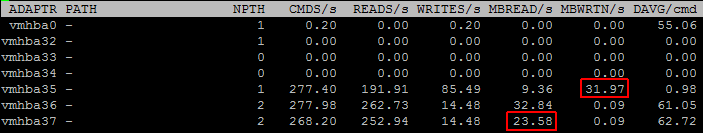
High IOPS and High Bandwidth are delivered from the local SSD. Shared storages does not see any traffic: